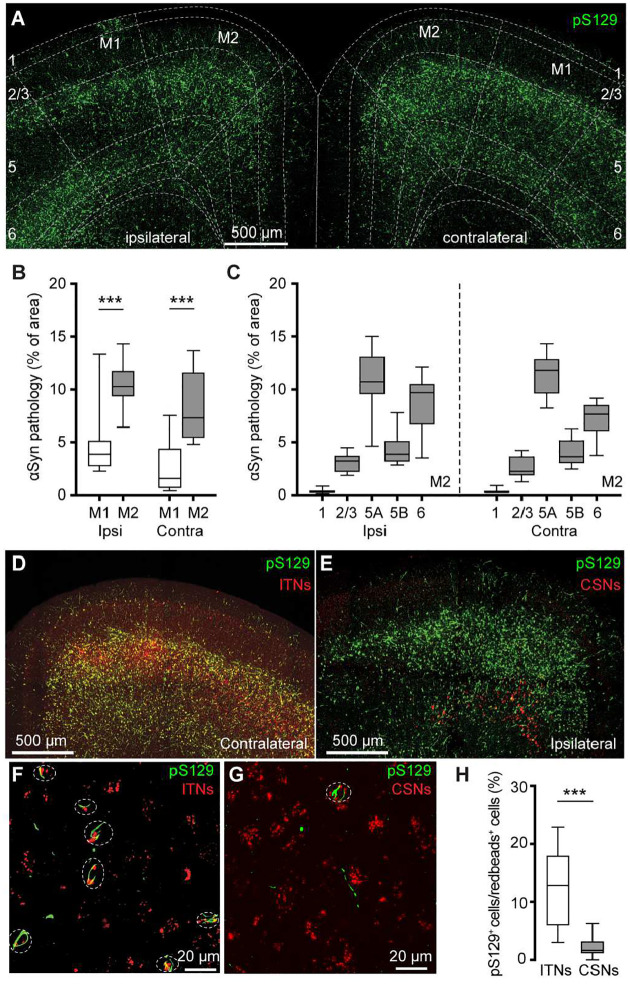
Figure 1. PFFs injection into the dorsal striatum seeds αSyn pathology in motor cortex.
(A) Representative confocal images showing the pS129+ αSyn pathology in the motor cortex at 3 months-post-injection (mpi). (B) The proportion of the motor cortical area covered by the pS129+ αSyn aggregation. (Ipsilateral, M1 = 3.9 [2.7, 5.2]%, M2 = 10.3 [9.3, 11.8]%, n = 12 slices/4 mice for each group; p = 0.0005, Mann–Whiney U (MWU) test. Contralateral, M1 = 1.6 [0.6, 4.4]%; M2 = 7.3 [5.4, 11.7]%, n = 12 slices/4 mice for each group, p = 0.0001, MWU). (C) The proportion of the different cortical layers covered by pS129+ αSyn aggregation. (D-G) Representative images showing the co-localization of Redbeads labeling with pS129+ αSyn pathology in motor cortex at low (D-E) and high (F-G) magnifications. (H) Summarized results showing that a higher percentage of ITNs than CSNs in M2 were pS129+ αSyn positive (ITNs = 12.9 [5.9, 18.0]%, n = 11 slices/4 mice; CSNs = 1.7 [1.1, 3.2]%, n = 12 slices/4 mice; p < 0.0001, MWU).

