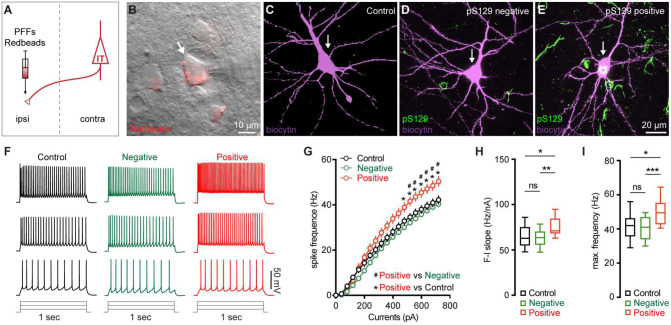
Figure 3. M2 neuronal hyperexcitability associated with αSyn pathology.
(A) Diagram showing the experimental design for co-injection of αSyn PFFs with Retrobeads into the contralateral dorsal striatum. B) Representative images showing a Retrobeads labeled ITN in the layer 5 of M2 that was targeted for electrophysiology recording and intracellular dialysis of biocytin. (C-E) Representative images showing biocytin labelled M2 ITNs neurons that were from controls (C), or pS129-negative (D) and pS129-positive (green, E) from PFFs-injected mice. (F) Representative spike trains of ITNs evoked by somatic current injections (+160 pA, +320 pA and +480 pA for 1 sec) from controls (left), as well as pS129-negative (middle) and pS129-positive (right) cells. (G) Frequency-current relationship of controls as well as pS129-negative and positive cells. Controls = 34 neuron/5 mice, pS129-negative = 53 neurons/9 mice, pS129-positive = 14 neurons/9 mice. p < 0.0001, pS129-positive group versus controls or pS129-negative ones, mixed effects model followed by Sidak’s test. (H-I) Summarized results showing an increased F-I slopes (H, Controls = 34 neurons/5 mice; pS129-negative = 53 neurons/9 mice; pS129-positive = 14 neurons/9 mice; p = 0.0068, Kruskal-Wallis test followed by Dunn’s test) and increased maximum frequency of firing in pS129-positive group relative to controls or pS129-negative ones (I, Control = 34 neurons/5 mice; pS129-negative = 53 neurons/9 mice; pS129-positive = 14 neurons/9 mice; p = 0.0039, Kruskal-Wallis test followed by Dunn’s test).

