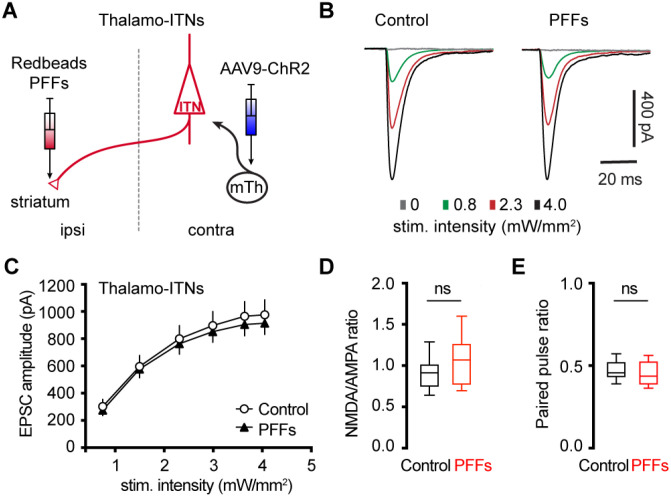
Figure 6. No change in the thalamocortical transmission to M2 ITNs in the PFFs seeding model.
(A) Diagram showing the experiment design to study thalamocortical transmission of M2 ITNs. (B and C) Representative traces of optogenetically evoked EPSCs in ITNs across different stimulation intensities from control and PFF groups (B) and the summarized results (C, control = 26 neurons/5 mice; PFF = 18 neurons/3 mice. p = 0.7391, mixed effects model followed by Sidak’s tests). (D) Box plots showing no change in the NMDA/AMPA ratio at thalamocortical synapses to M2 ITNs between controls and PFFs-injected mice (control = 0.91 [0.75, 1.02], 26 neurons/5 mice; PFFs = 1.07 [0.77, 1.26], 18 neurons/3 mice, p = 0.09, MWU). (E) Box plots showing no change in the paired pulse ratio at thalamocortical synapses to M2 ITNs between controls and PFFs-injected mice (control = 0.46 [0.43, 0.53], 21 neurons/5 mice; PFFs = 0.44 [0.39, 0.53], 16 neurons/3 mice, p = 0.44, MWU).

