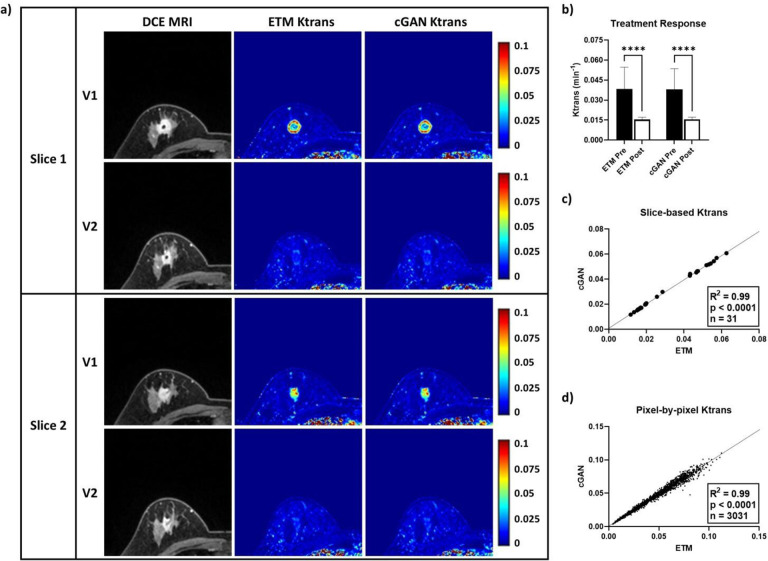
Figure 3. TCIA pCR patient tested using the DCE-to-PK cGAN.
Two representative DCE MRI slices from a pCR patient revealed a highly enhanced tumor lesion at both pre-treatment, V1, and post-NACT, V2. Notably, Ktrans maps produced by the ETM and cGAN had excellent spatial correlation and high structural similarity (a). Quantification of tumor mean Ktrans (b) at V1 (n = 19 slices) and V2 (n = 12 slices) revealed substantially decreased vascular permeability at V2 by both the ETM and cGAN (p < 0.0001). Analysis of slice-based mean Ktrans (c) and pixel-by-pixel Ktrans (d) showed strong correlations (R2 = 0.99) between the cGAN and ETM (p < 0.0001). Mean ± SD, ****p < 0.0001.

