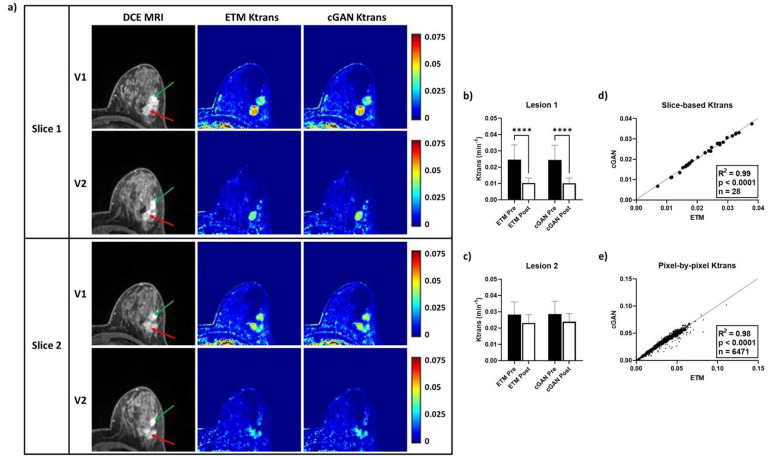
Figure 4. DCE-to-PK cGAN deciphered intra-patient heterogeneous tumor response.
In a representative patient, two highly enhanced tumor lesions, lesion 1 (green arrow) and lesion 2 (red arrow), were identified on DCE images (a). Notably, ETM and cGAN Ktrans maps showed elevated vascular permeability at V1 for both lesions. Interestingly, both ETM and cGAN V2 Ktrans maps revealed markedly decreased vascular permeability for lesion 1 (b) and retained vascular permeability for lesion 2 (c). Slice-based mean Ktrans (d) and pixel-by-pixel Ktrans (e) analysis showed strong correlations (R2 = 0.98) between the cGAN and ETM (p < 0.0001). Mean ± SD, ****p < 0.0001.

