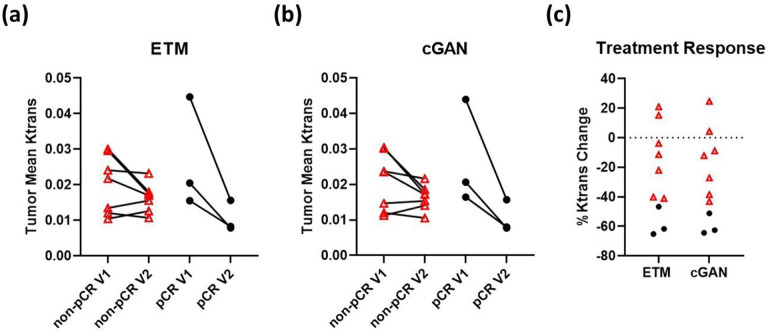
Figure 6. DCE-to-PK cGAN enables early prediction of responders to NACT.
Scatter plots of tumor mean Ktrans for both ETM (a) and cGAN (b) revealed differential vascular changes to NACT between non-pCR patients (red triangles) and pCR patients (black circles). Notably, in good agreement with previous work7, Ktrans percentage changes (c) clearly distinguished the non-pCR from the pCR patients.

