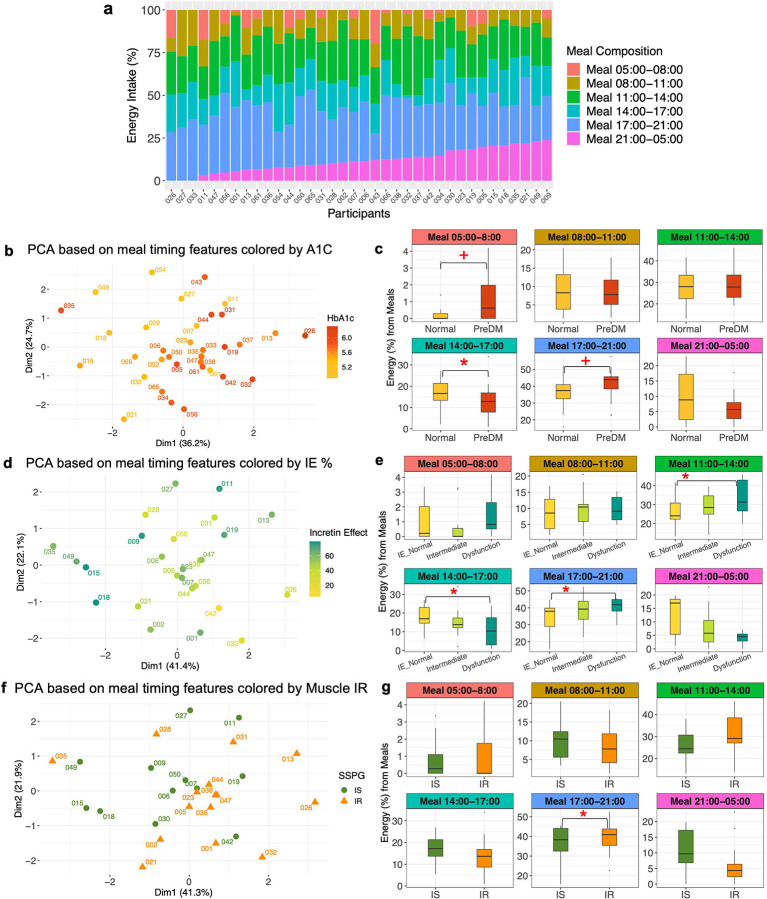
Figure 2. Meal timing patterns associated with distinct metabolic characteristics.
a, Heterogeneity in meal timing profiles between persons (n = 36). The food and beverage consumption (referred to as “meal”) periods were segmented into six windows. 1) 05:00 and 08:00; 2) 08:00 and 11:00; 3) 11:00 and 14:00; 4) 14:00 and 17:00; 5) 17:00 and 21:00; and 6) 21:00 and the next day 05:00. The energy intake contribution from each meal timing window relative to the total daily energy intake was determined. A bar indicates each participant. Different colors comprising the bar represent six meal timings. The length of the color corresponds to the contribution (%) of each meal to the total daily energy intake (100%).
b, PCA plot showing the cohort separation by the six meal timing features. A circle-shaped point indicates each participant. The color gradation represents one’s HbA1c level ranging from low (yellow) to high (red).
c, Box plots showing differences in energy contribution from six meal timings by glycemic status (normoglycemia when HbA1c<5.7% (HbA1c< 39 mmol/mol) and prediabetes when 5.7% ≤HbA1c<6.5% (39 mmol/mol ≤HbA1c<48 mmol/mol)). Statistical significance was derived from the covariate-adjusted multiple linear regression models including HbA1c, age, sex, BMI, and ethnicity. The central line inside the box represents the median, and the error bars indicate 1.5 times the IQR from the lower and upper quartiles. The symbols indicate a statistically significant difference (BH-adjusted P value < 0.05 for asterisk, and BH_adjusted P value < 0.1 for cross) in energy contribution from each meal timing between normoglycemia and prediabetes groups. PreDM, prediabetes.
d, PCA plot showing the cohort separation by the six meal timing features. A circle-shaped point indicates each participant. The color represents one’s incretin effects ranging from low (yellow), intermediate (light green), to high (dark green).
e, Box plots showing differences in energy contribution from six meal timings by incretin effects. Statistical significance was derived from the covariate-adjusted multiple linear regression models including incretin effects %, age, sex, BMI, and ethnicity. The central line inside the box represents the median, and the error bars indicate 1.5 times the IQR from the lower and upper quartiles. The asterisk indicates a statistically significant difference in energy contribution from each meal timing among the incretin groups (BH-adjusted P value <0.05). IE, incretin effect.
f, PCA plot showing the cohort separation into two clusters by the six meal timing features. A point indicates each participant, and the different shapes and colors of the points represent muscle insulin sensitivity status (green circle for IS and orange triangle for IR).
g, Box plots showing differences in energy contribution from six meal timings by muscle insulin sensitivity. Statistical significance was derived from the covariate-adjusted multiple linear regression models including insulin sensitivity (SSPG), age, sex, BMI, and ethnicity. The central line inside the box represents the median, and the error bars indicate 1.5 times the IQR from the lower and upper quartiles. The asterisk indicates a statistically significant difference (BH-adjusted P value < 0.05) in energy contribution from each meal timing between IS and IR groups. IS, insulin sensitive; IR, insulin resistant.

