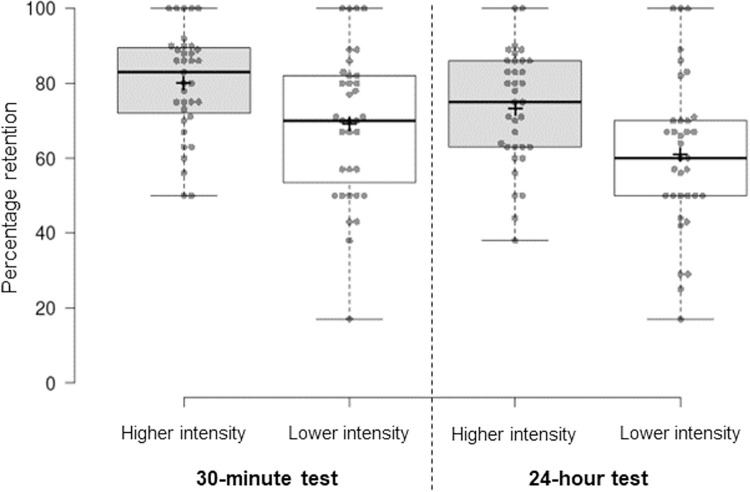
Fig 2. Memory retention scores.
The box plot shows percentage retention scores for the higher intensity (grey boxes) and lower intensity (white boxes) exercise conditions from the 30-minute and 24-hour test. Percentage retention scores were computed as the number of words recalled correctly in a delayed test divided by the number of words recalled correctly in the immediate test, multiplied by 100. Centre lines show the medians; box limits indicate the 25th and 75th percentiles; whiskers extend to minimum and maximum values; crosses represent sample means; data points are plotted as open circles. Percentage retention scores were significantly greater in the higher intensity than lower intensity condition in the 30-minute and this effect was maintained in the 24-hour test.

