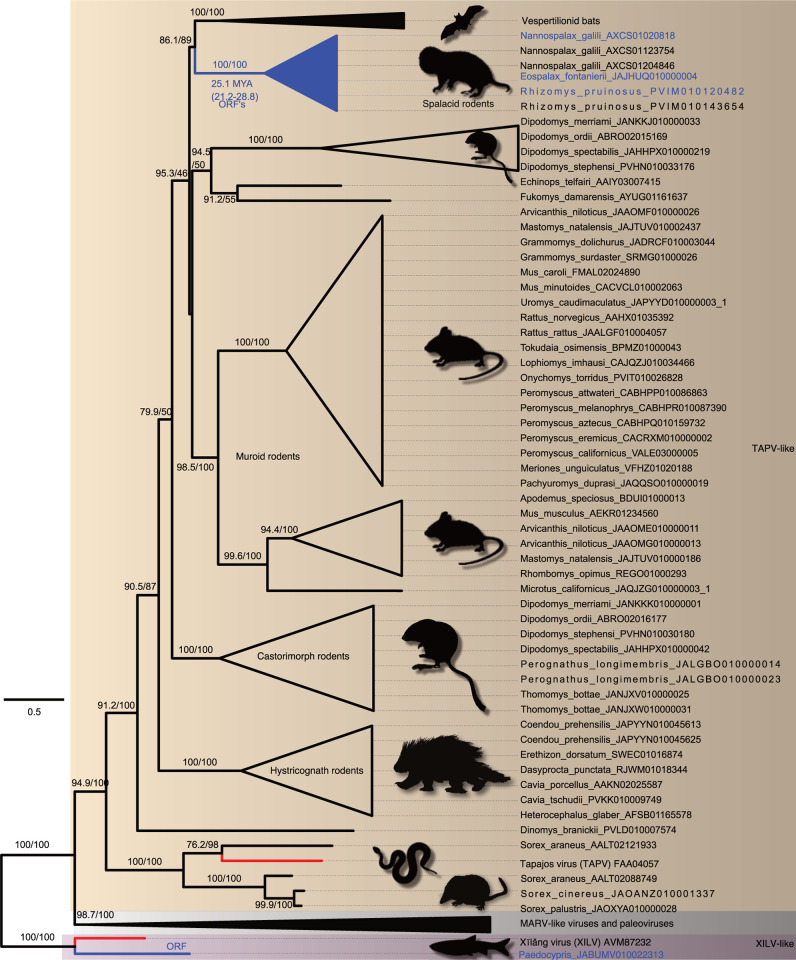
Fig 5. Maximum likelihood phylogram based on the amino acid sequences of the NP or nucleoprotein gene of filoviruses and the NP-like paleoviruses from vertebrates.
Black shaded triangles are large clades that were collapsed to save space. Red lines indicate viral lineages, blue lines indicate vertebrate sequences with open reading frames and black lines indicate vertebrate paleoviral sequences that are pseudogenes. Numbers represent approximate likelihood ratio test values and bootstrap values. The scale bar is present. Tree is rooted by XILV and the full expanded tree is presented in S6 Fig.

