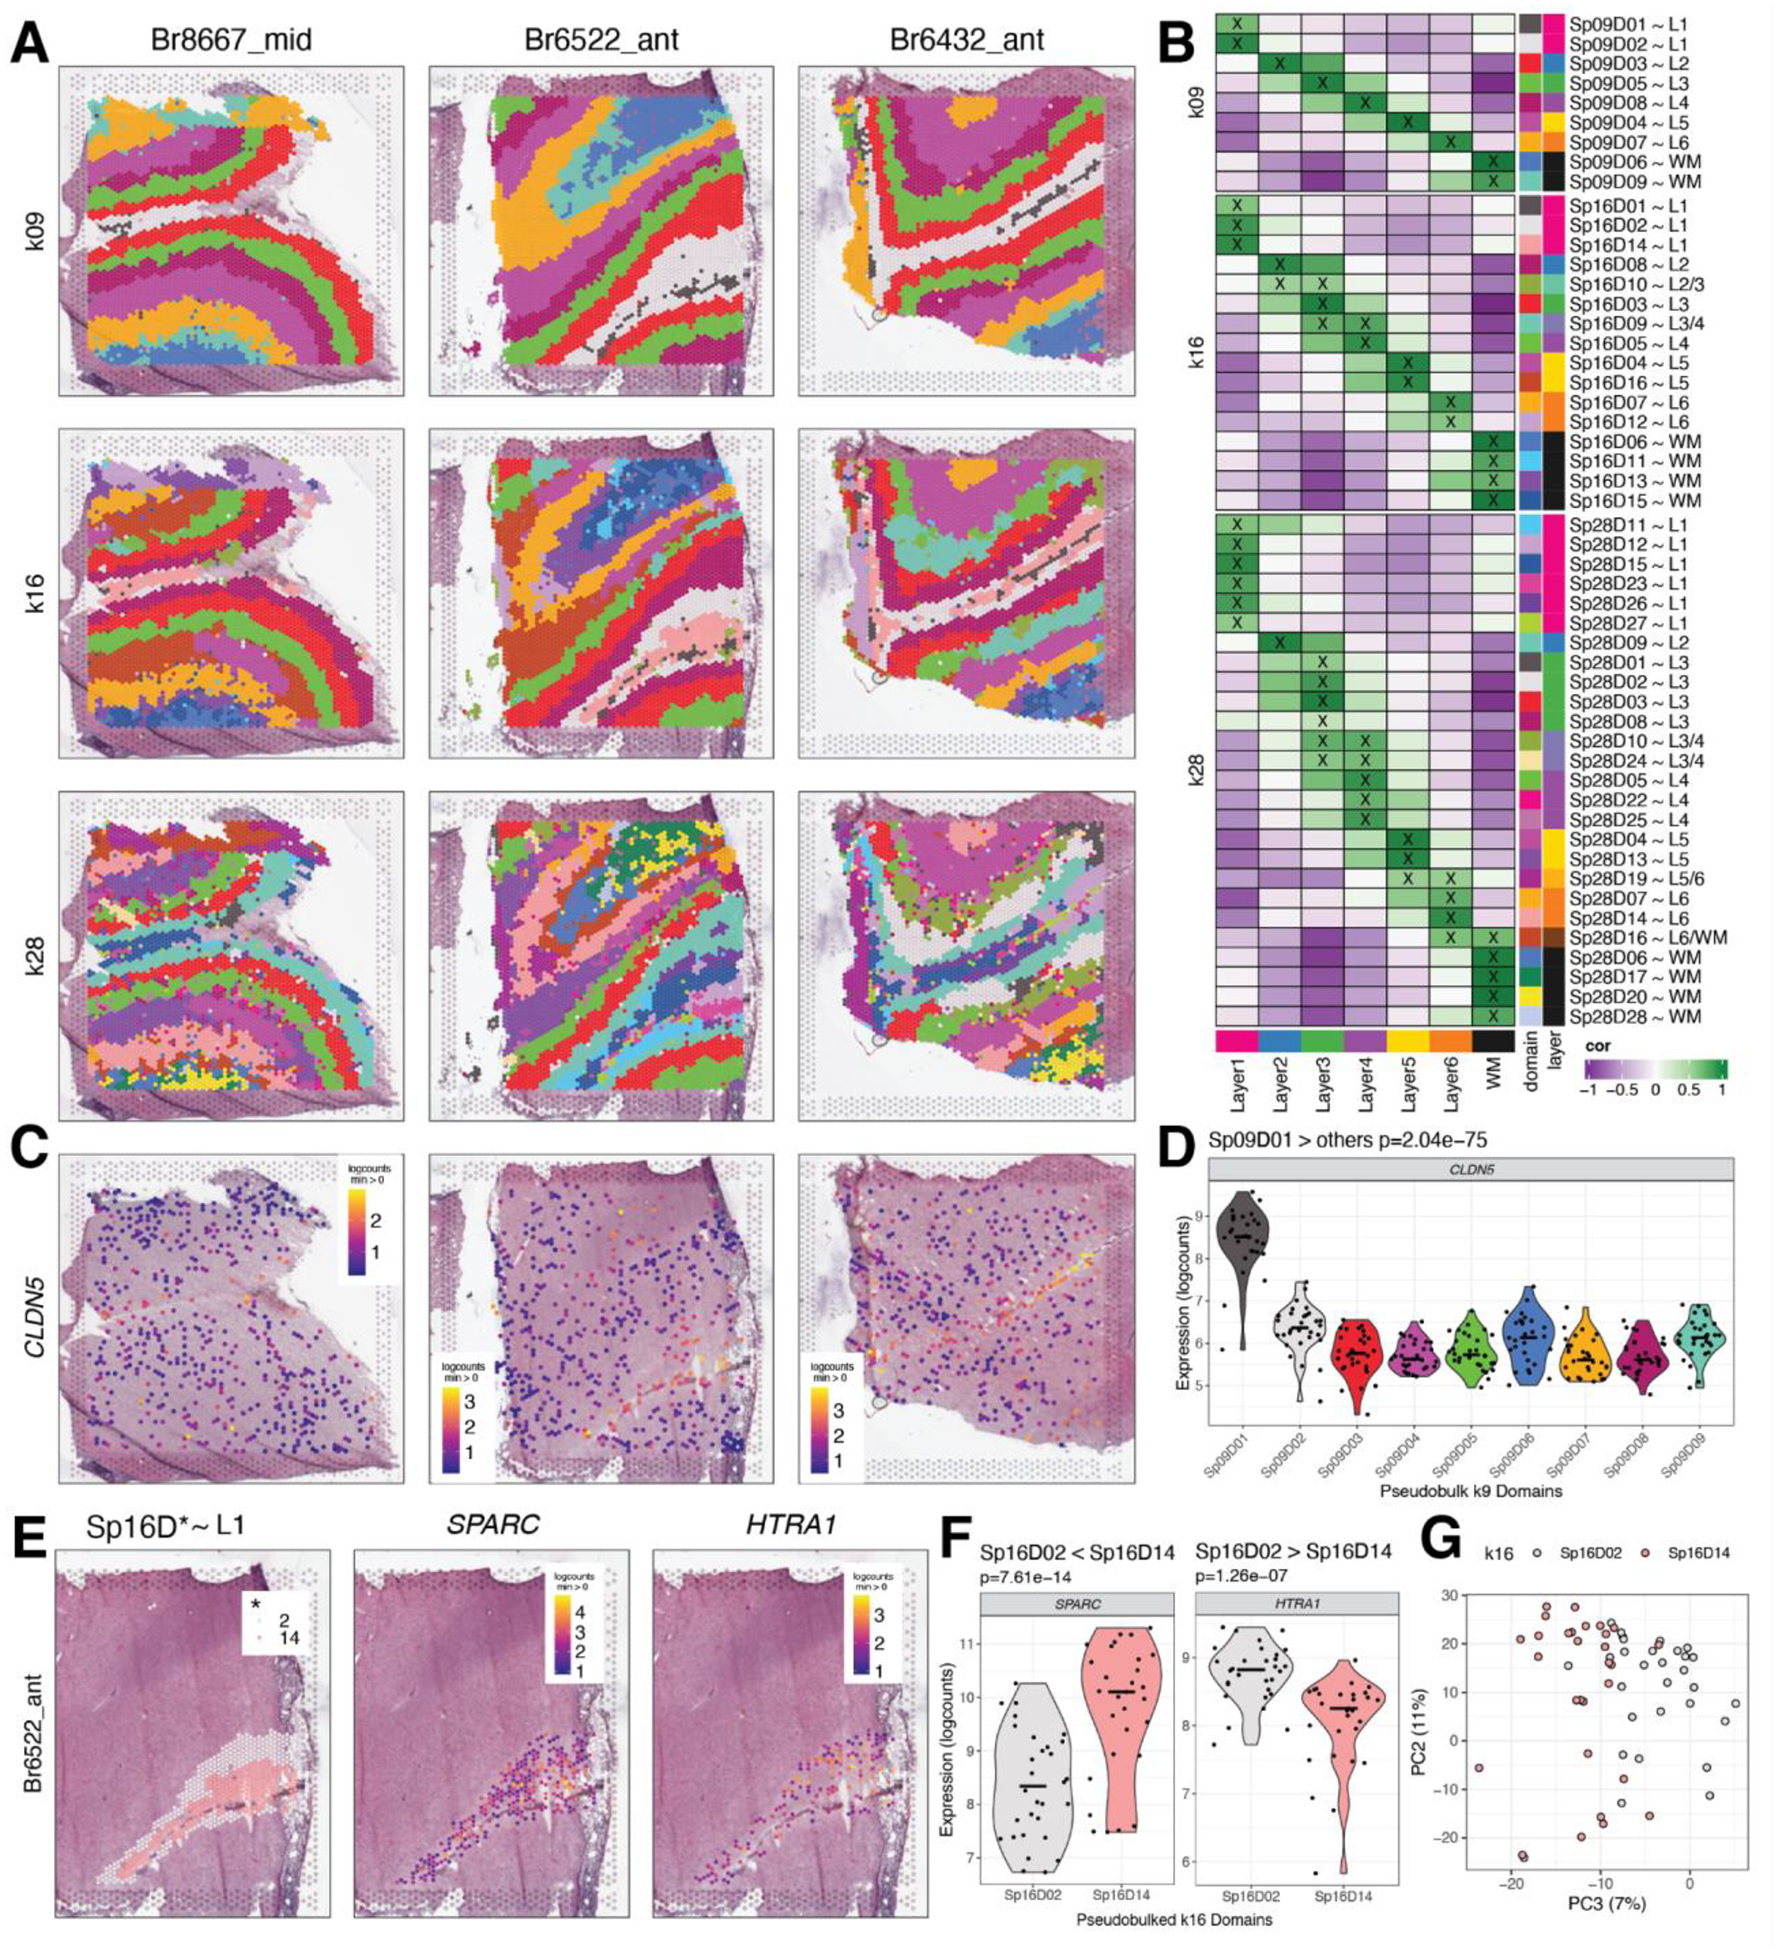
Figure 2. Unsupervised clustering at different resolutions identifying spatial domains (SpDs) and defining molecular anatomy of DLPFC.

(A) BayesSpace clustering at k=9, 16, and 28 (broad, fine, and super-fine resolution, respectively, which we refer to as SpkDd for domain d from SpDs at k resolution) for three representative DLPFC tissue sections (Br8667_mid, Br6522_ant, Br6432_ant). (B) Heatmap of spatial registration with manually annotated histological layers from (12). BayesSpace identifies laminar SpDs at increasing k with the majority of SpkDs correlating with one or more histological layer(s). SpDs were assigned layer annotations following spatial registration to histological layers. Annotations with high confidence (cor > 0.25, merge ratio = 0.1, see Methods: Spatial registration of Spatial Domains) are marked with an “X”, and this histological layer association is denoted for a given SpkDd by adding “~L,” where L is the most strongly correlated histological layer (or WM). See also Fig S11–Fig S18. (C) Spotplots depicting expression of CLDN5 in vasculature domain 1 at k=9 resolution (Sp9D1). (D) Boxplot confirming enrichment of CLDN5 in Sp9D1 compared to other Sp9Ds across 30 tissue sections. (E) Spotplots of representative section Br6522_ant showing identification of molecularly-defined sublayers for histological L1 at k=16 (Sp16D2 and Sp16D14) and enrichment of HTRA1 and SPARC, respectively. (F) Boxplots quantifying enrichment of SPARC and HTRA1 in Sp16D14 and Sp16D2, respectively, across 30 tissue sections. (G) PCA plot showing separation of Sp16D2 and Sp16D14 supporting identification of molecularly distinct SpDs.
