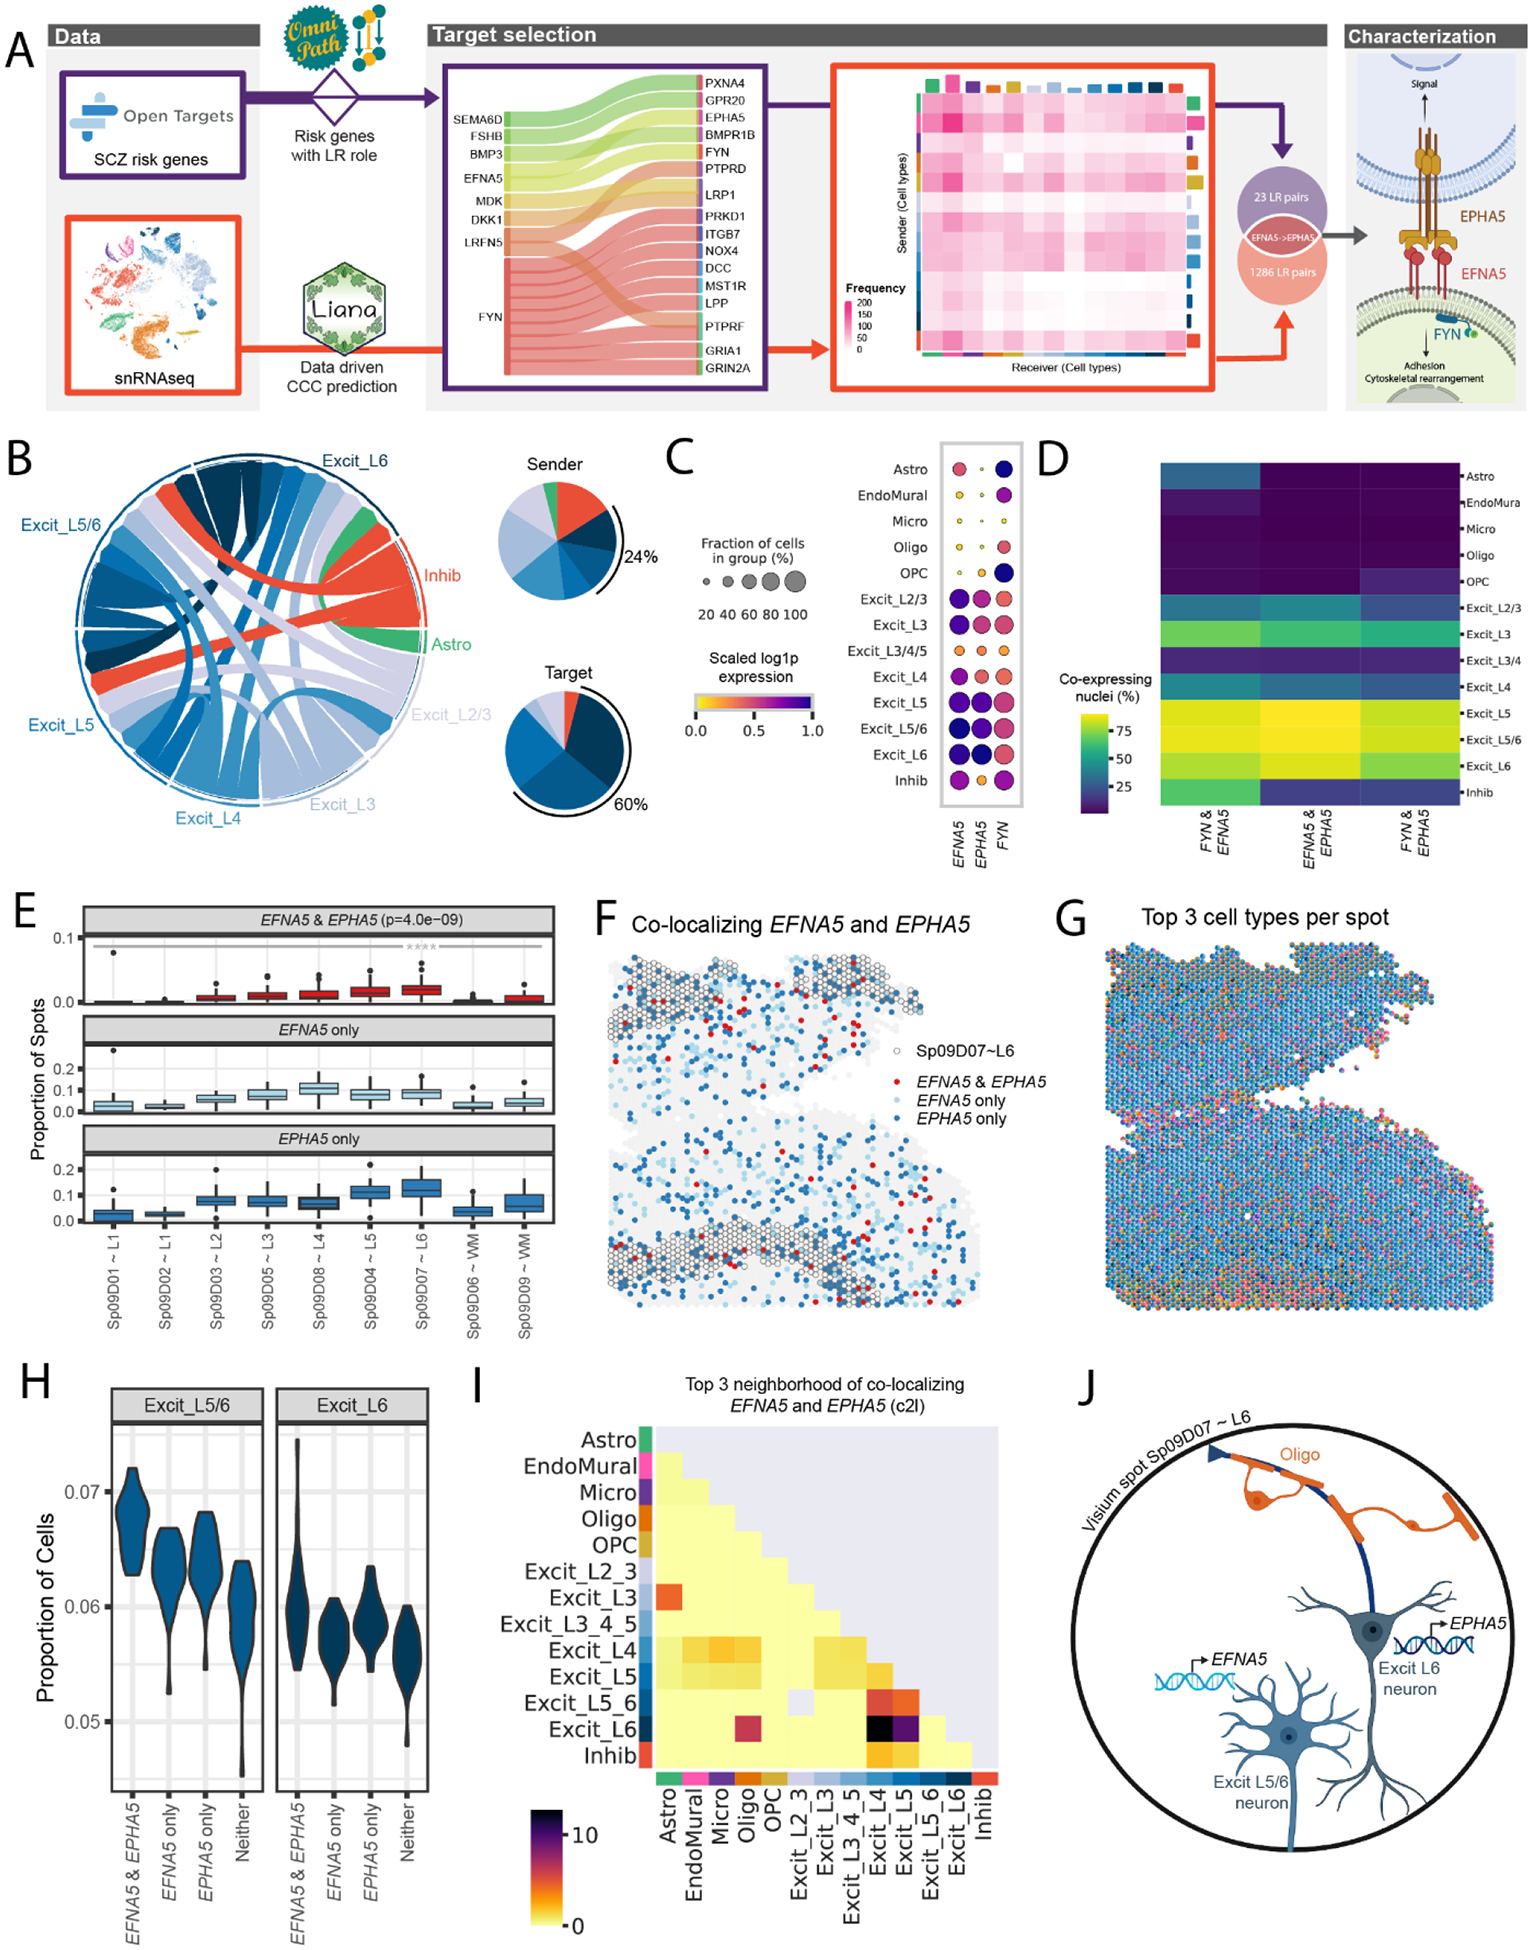
Figure 5. Schizophrenia (SCZ)-associated ligand-receptor (LR) interactions identified by integrative analysis of snRNA-seq and Visium data.

(A) The LR interaction between membrane-bound ligand ephrin A5 (EFNA5) and ephrin type-A receptor 5 (EPHA5) is a consensus target identified in both data-driven (Table S3) and clinical risk-driven LR (Table S4) analyses. Notably, this interaction also requires an intracellular interaction between EFNA5 and protein tyrosine kinase (FYN), which was also identified among clinical risk targets. (B) Cell-cell communication analysis predicts the sender/receiver cross-talk pattern of EFNA5-EPHA5 between layer-level cell types visualized in a circular plot. Excit_L5/6 and Excit_L6 neurons account for 24% of the cross-talk as senders and 60% as targets compared to other cell types shown in the pie charts. (C-D) Downstream analysis of snRNA-seq data characterizes FYN-EFNA5-EPHA5 signaling pathway, showing these genes are highly enriched (C) and co-expressed (D) in excitatory neuron populations. (E) Across all 30 tissue sections, EFNA5 and EPHA5 are co-expressed in a statistically higher proportion of spots in Sp9D7 (median (interquartile range) = 0.0196 (0.0137), p = 4.0e-09) compared to other Sp9Ds (Sp9D1 = 0 (0), Sp9D2 = 0 (0), Sp9D3 = 0.0052 (0.0078), Sp9D4 = 0.0140 (0.0142), Sp9D5 = 0.0091 (0.0102), Sp9D6 = 0 (0.0016), Sp9D8 = 0.0077 (0.0123), Sp9D8 = 0.0016 (0.0104)). (F) Spotplot of EFNA5 and EPHA5 co-expression in Br8667_mid. (G) Spotplot with spot-level pie charts for Br8667_mid showing the top 3 dominant cell types in each Visium spot predicted by Cell2location (c2l). (H) Visium spots co-expressing EFNA5 and EPHA5 have higher proportions of predicted Excit_L5/6 neurons (p=1.8e-12) and Excit_L6 (p=3.9e-4) compared to non-coexpressing spots, consistent with snRNA-seq specificity analyses (Fig S42). Few other cell types show this relationship (Fig S43). Complementary analyses of EFNA5 and FYN co-expression are shown in Fig S42. (I) Spatial network analysis of all 30 tissue sections, using top 3 dominant c2l cell types in each spot (exemplified in G with Br8667_mid), confirms EFNA5 and EPHA5 co-expression occurs frequently in spots containing Excit_L6 neurons. Complementary analyses using top 6 dominant c2l cell types as well as Tangram predictions are reported in Fig S42. (J) Schematic of a Visium spot depicting EFNA5-EPHA5 interactions between Excit_L5/6 neurons and Excit_L6. The high colocalization score in the spatial network analysis in (I) suggests oligodendrocytes also likely co-exist with Excit_L6 neurons.
