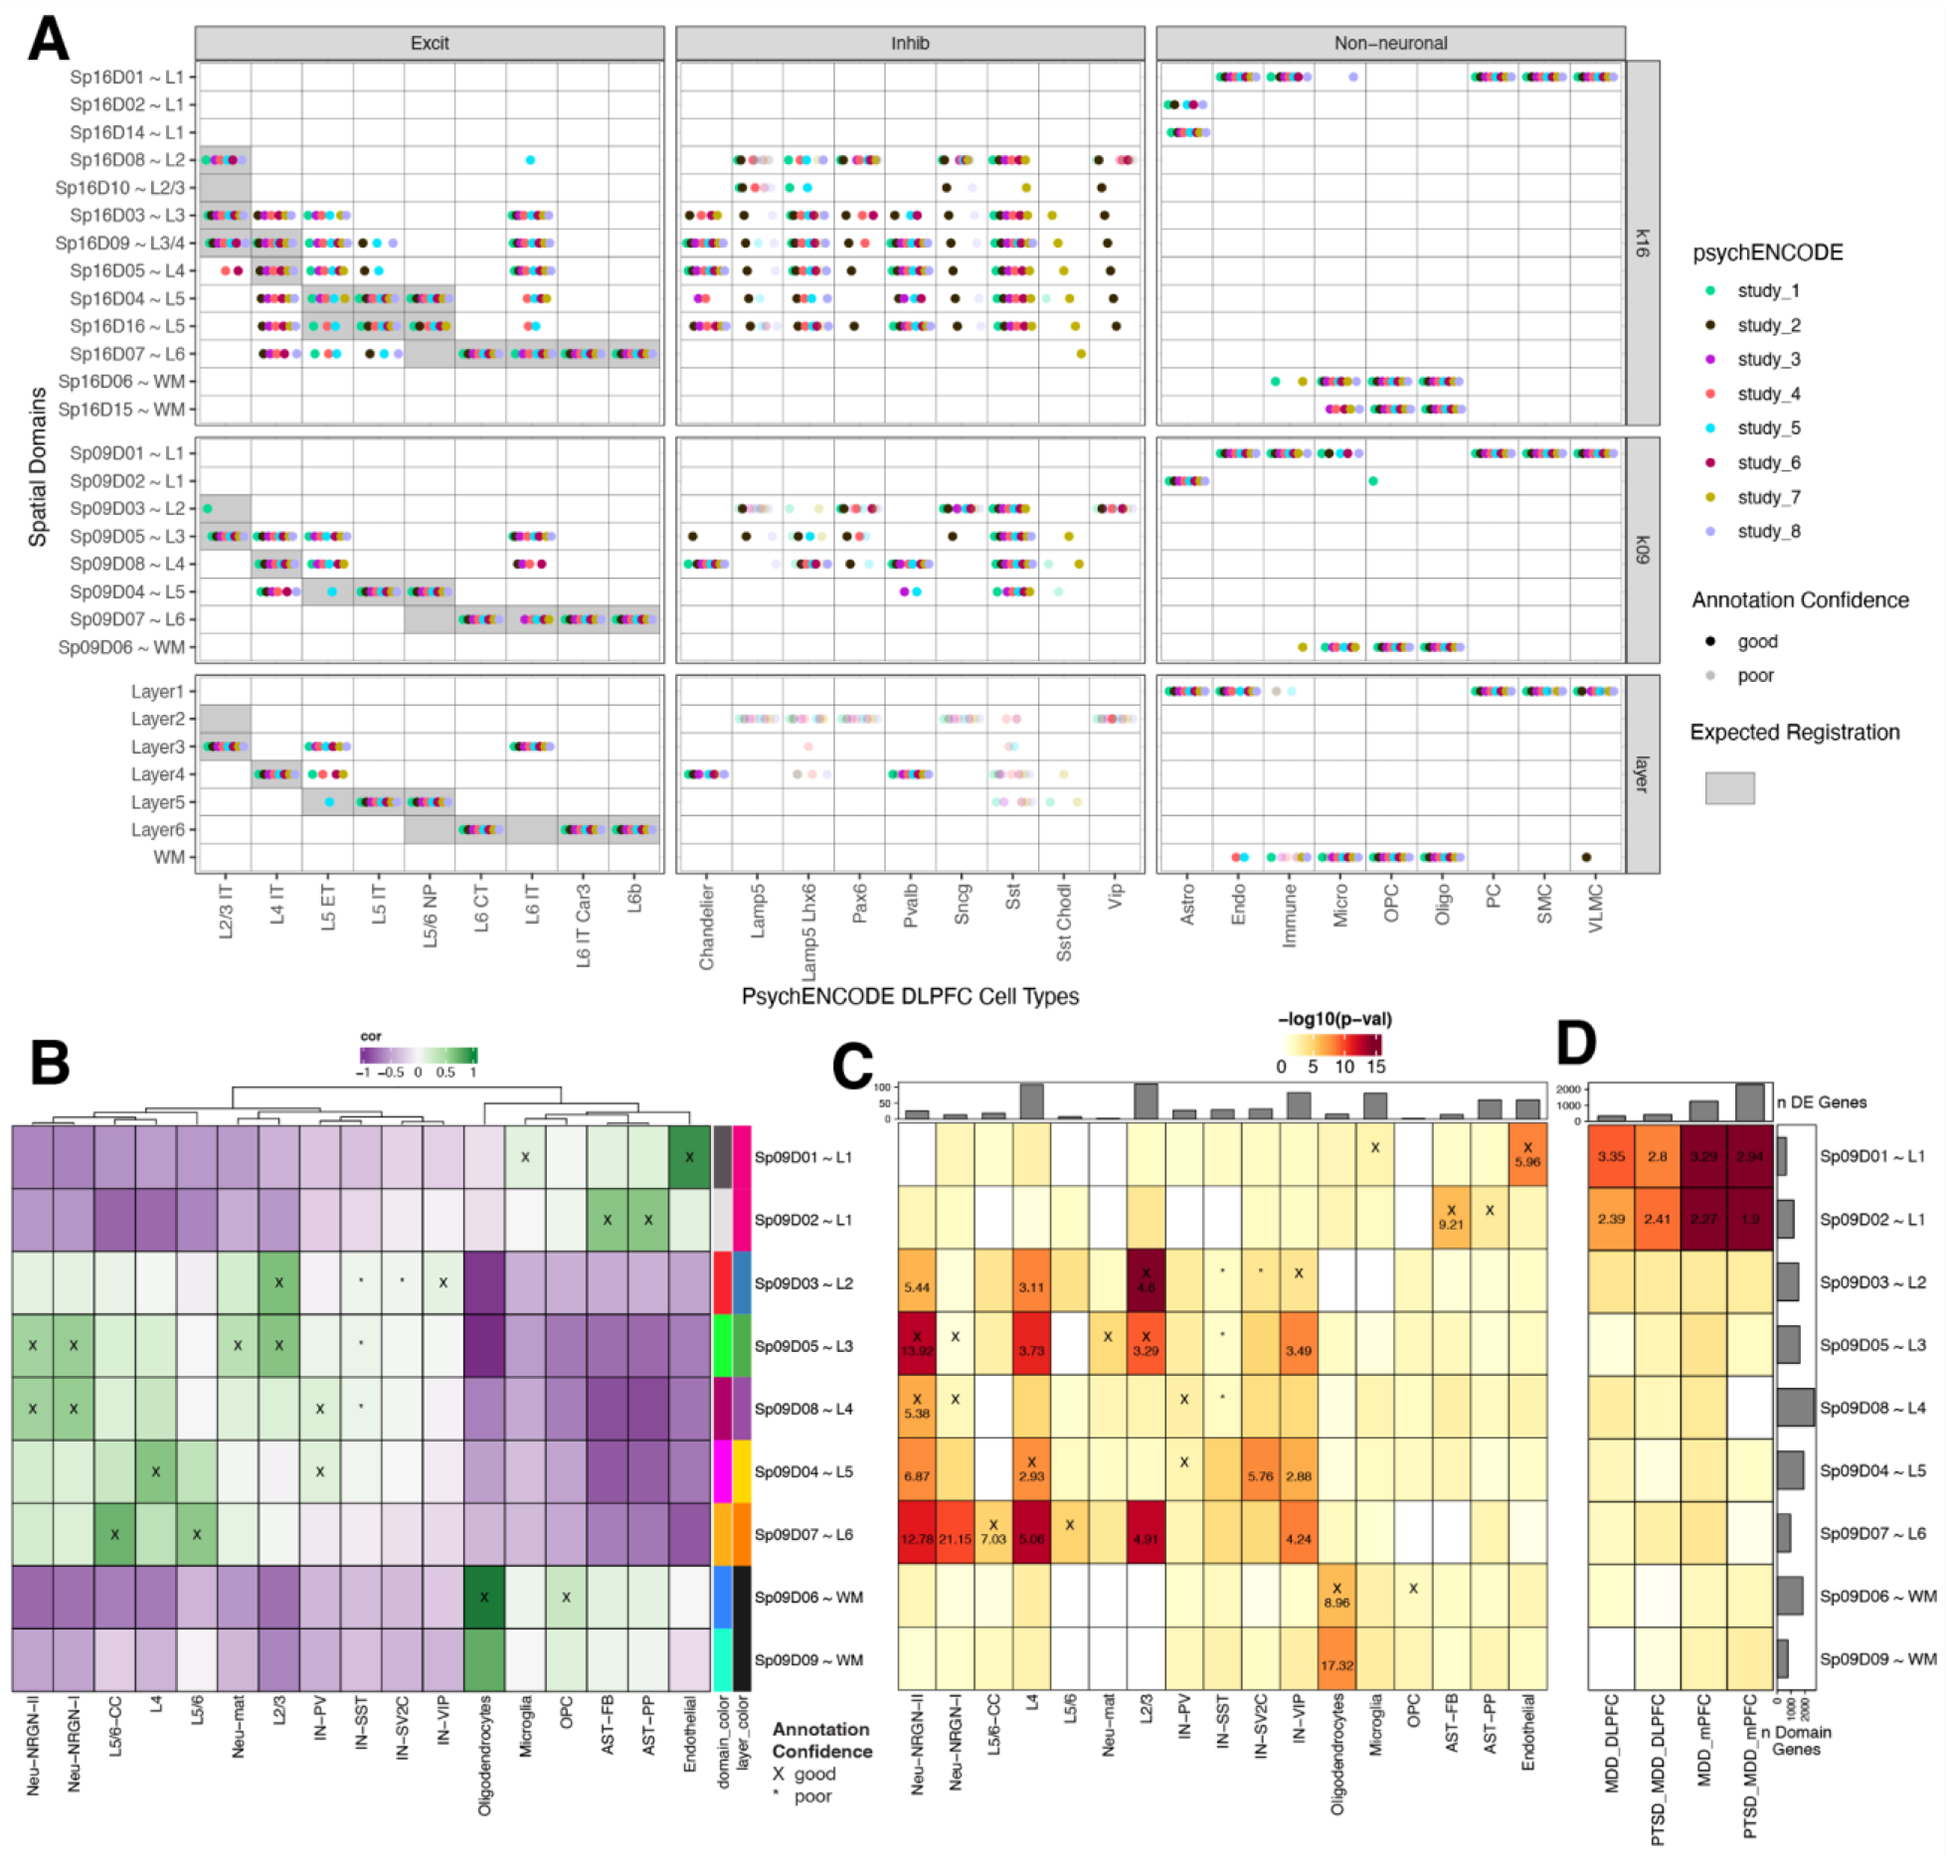
Figure 6. Spatial enrichment of cell types and genes associated with neurodevelopmental and neuropsychiatric disorders.

(A) Dot plot summarizing spatial registration results for eight PsychENCODE (PEC) snRNA-seq datasets from human DLPFC. snRNA-seq data was uniformly processed through the same pipeline and annotated with common nomenclature based on work from Allen Brain Institute (35, 69). Registration was performed for control donors only (see Fig S44 for full dataset) across manually annotated histological layers from (12) as well as unsupervised BayesSpace clusters at k=9 and k=16 (Sp9Ds and Sp16Ds, respectively). Each dot shows the histological layer(s) or SpD(s) where a dataset’s cell type was annotated during spatial registration. Solid dots show good confidence in the spatial annotation, translucent dots show poor confidence in the annotation. IT, intratelencephalon-projecting; ET, extratelencephalon-projecting; CT, corticothalamic-projecting; NP, near-projecting; VLMC, vascular lepotomeningeal cell; OPC, oligodendrocyte precursor cell; PC, pericyte; SMC, smooth muscle cell. (B) Spatial registration of cell type populations from control samples from (20) against unsupervised BayesSpace clusters at k=9 (Sp9Ds). Higher confidence annotations (cor > 0.25, merge ratio = 0.1, Supplemental Methods: Spatial registration of PsychENCODE and other external snRNA-seq datasets) are marked with an “X”. (C) Enrichment analysis using Fisher’s exact test for Sp9D- enriched statistics versus differentially expressed genes (DEGs, FDR < 0.05) in Autism spectrum disorder (ASD) for each cell type population. The values are the odds ratios (ORs) for the enrichment in significant (FDR < 0.001) blocks of the heatmap, and the color scale indicates −log10(p-value) for the enrichment test. The top bar plot shows the number of DEGs for each cell type. (D) Enrichment analysis using Fisher’s exact test for Sp9D- enriched statistics versus differentially expressed genes (DEGs, FDR < 0.05) in Post Traumatic Stress Disorder (PTSD) and/or Major Depressive Disorder (MDD) in bulk RNA-seq of DLPFC and medial prefrontal cortex (mPFC) (23). Top bar plot shows the number of DEGs for each DE test. Left bar plot shows the number of significantly enriched genes for each Sp9D in both enrichment analyses.
