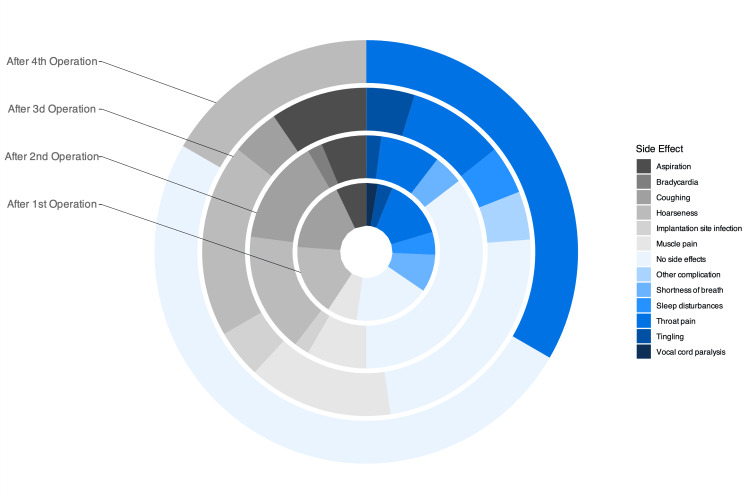
Figure 3. Overlaid pie charts representing the side effect proportions after each surgery.
This figure illustrates the percentage of patients experiencing various side effects after each surgery. The overlaid pie charts show a trend toward the three main persistent side effects: dysphonia, sore throat, and cough.

