. 2024 Sep 13;13:RP96394. doi: 10.7554/eLife.96394

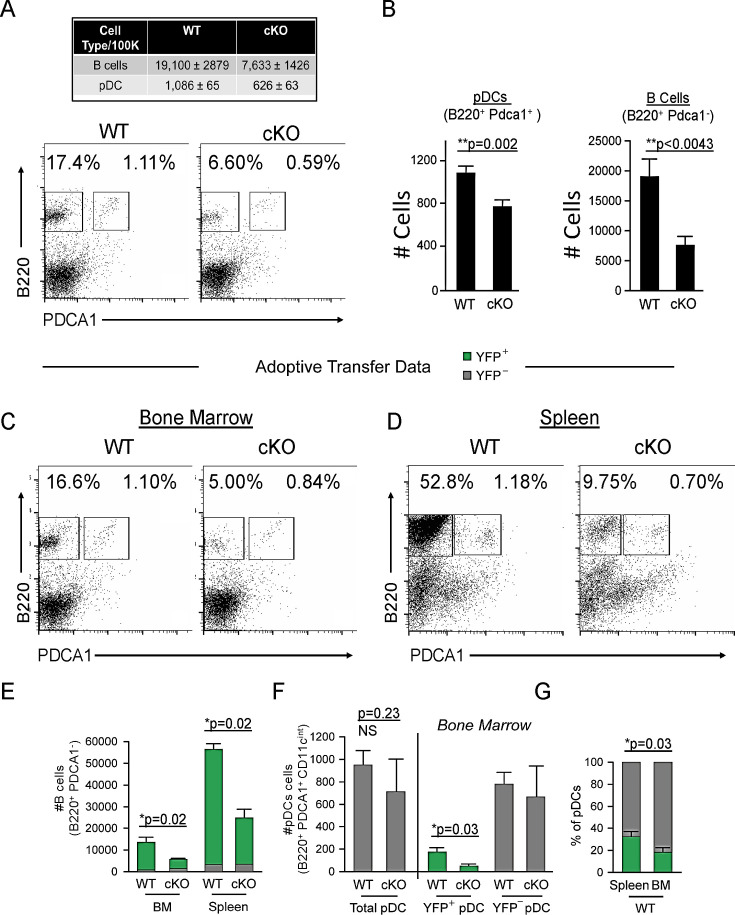
Figure 1. Cd79a-Cre deletion of Bcl11a identifies a common lymphoid progenitor (CLP)-derived subset of plasmacytoid dendritic cells (pDCs).

(A) Representative FACS plots of pDC (gated as B220+ PDCA1+) and B cell (gated as B220+ PDCA1-) percentages in the bone marrow (BM) of Bcl11a F/F Cd79a-Cre mice (cKO) and littermate controls. (B) Quantification of pDC and B cell populations in the BM of Bcl11a F/F Cd79a-Cre mice (cKO) and littermate controls as cells/100,000 cells. (C–D) Flow cytometric analysis of BM and spleens of recipient mice 8 weeks post BM transplantation. BM was transferred from either BCL11A-sufficient reporter control mice (Cd79a-Cre-YFP) or BCL11A-deficient cKO mice (Bcl11a F/F Cd79a-Cre-YFP) into lethally irradiated C57BL/6J recipients. (E) B cell numbers after BM transplantation in BM and spleens of recipient mice. (F) pDC numbers after BM transplantation in BM and spleens of recipient mice. (G) Comparison of YFP+ pDC percentages in the spleen and BM of recipient mice post BM transplantation. Mann-Whitney t-tests were used for all statistical comparisons. Error bars=mean±s.d. The results are representative of two experiments each containing 3–4 mice per group.

Figure 1.

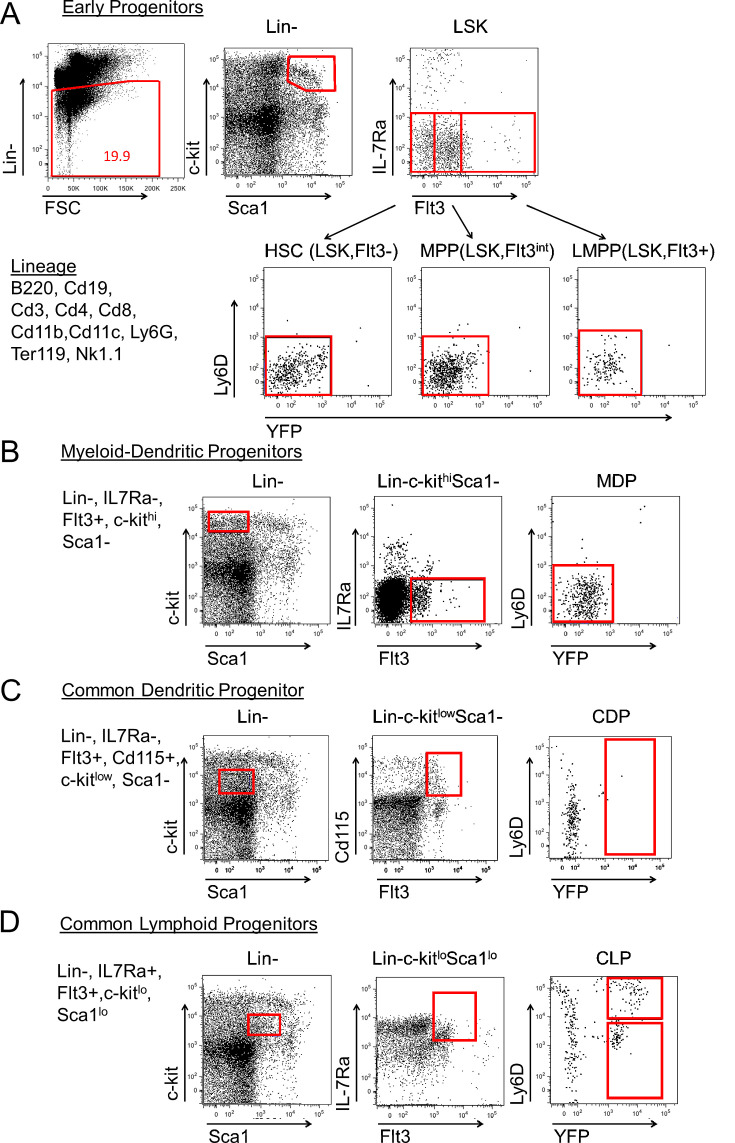
Figure 1—figure supplement 1. Progenitor population analysis for Cd79a-cre driven YFP expression.

Figure 1—figure supplement 1.

We analyzed YFP expression in bone marrow (BM) progenitors to determine when and where Cd79a-Cre is active (representative plots shown). (A) Lineage negative cells were analyzed to examine LSK hematopoietic progenitor (Lin-, Sca-1+, c-Kit+), MPP (LSK, Flt3int), and LMPP (LSK, Flt3hi) populations. Virtually all cells were YFP-. (B) Myeloid dendritic progenitors (MDPs; Lin-, IL7Rα-, Flt3+, c-kithi, Sca1-) and (C) common dendritic cell progenitors (CDPs; Lin-, IL7Ra-, Flt3+, c-kitlo, Sca1-, CD115+) were also negative for YFP expression, while (D) common lymphoid progenitors (CLPs; Lin-, IL7Ra+, Flt3+, c-kitlo, Sca1lo) contained YFP+ cells. The results are representative of three independent experiments each containing at least 3 mice per group.

Figure 1—figure supplement 2. Cell distributions in the spleen of adoptively transferred recipient mice.
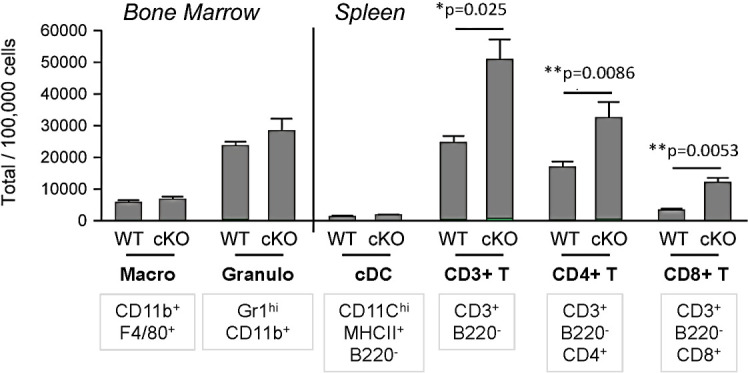
Figure 1—figure supplement 2.

Both Bcl11a F/F Cd79a-Cre+ and Cd79a-Cre-YFP adoptively transferred recipient mice reconstituted other splenic cell types in normal numbers, including bone marrow (BM) macrophages (CD11b+ F4/80+), granulocytes (Gr-1+ CD11b+), and splenic conventional dendritic cells (cDCs) (CD11c+ CD11b+ B220-). Total T cells (CD3+ B220-) as well as CD4+ and CD8+ subsets were significantly increased in number in proportion to B/pDC cell loss. Mann-Whitney t-tests were used for all statistical comparisons. The results are representative of two independent experiments each containing 3–4 mice per experimental group. Error bars = mean ± s.d.