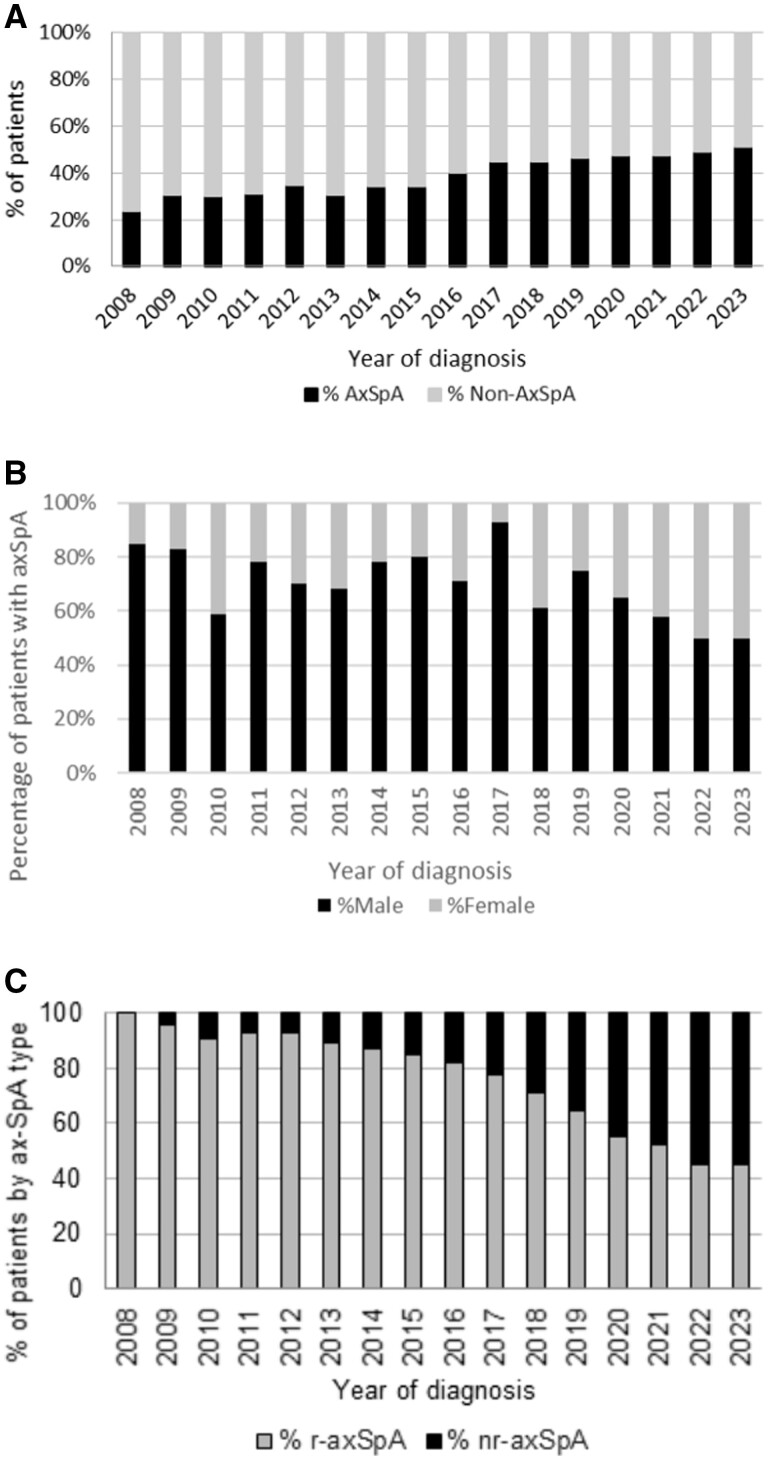
Figure 2.
The number, sex and classification of axSpA in this study. (A) Percentage of patients referred with final diagnosis of axSpA (black-filled bars) and not-axSpA (grey-filled bars) by year of diagnosis. (B) The percentage of male patients (black-filled bars) and female patients (grey-filled bars) diagnosed with axSpA per year. (C) Percentage of radiographic axSpA (grey-filled bars) and non-radiographic axSpA (black-filled bars) in patients diagnosed with axSpA per year

