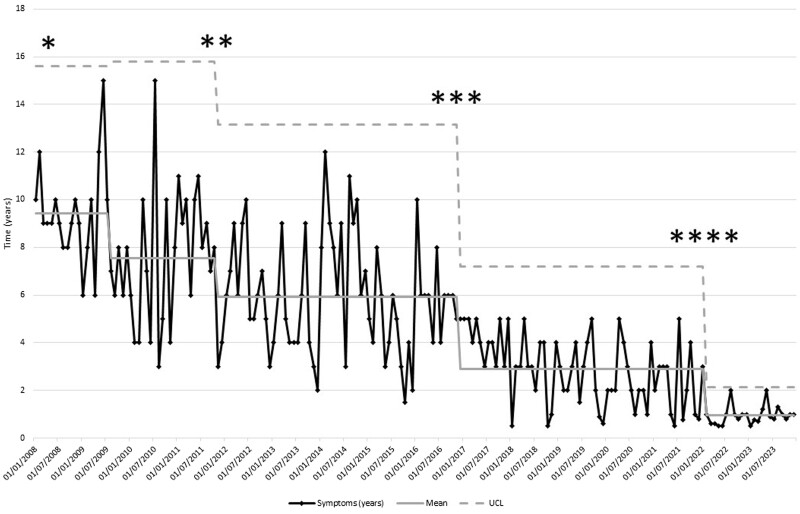
Figure 3.
The SPC chart for the mean time to diagnosis (in years) of axSpA in the months during the period of the study from 2008 to 2023. *axSpA clinic/pathway and public awareness campaigns commenced. **Implementation and use of ASAS axSpA recommendations for referral [15]. ***Setting up of the IPASS. ****Implementation of the Rheumatology Academy and Collaborative Network (RheumACaN). x-axis: date of diagnosis (years); y-axis: time to diagnosis

