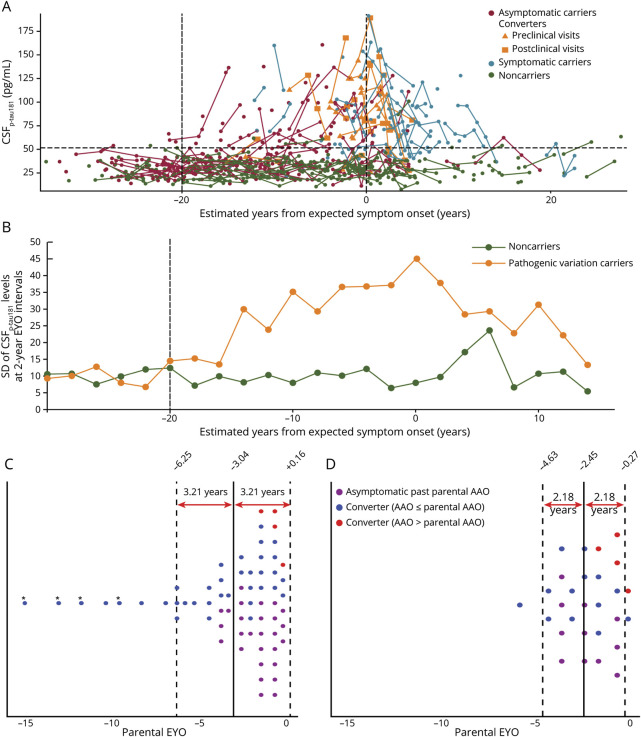
Figure 2. Determination of the Analytical Population in Cohort 1 (A and B) and Cohort 2 (C and D).
(A) Cohort 1. Interindividual variability in longitudinal CSFp-tau181 levels plotted against estimated years from expected symptom onset (EYO) in 194 asymptomatic carriers (shown in red, 386 visits), 21 converters (shown in orange, 68 visits), and 64 symptomatic carriers (shown in blue, 161 visits) whose first visits were within 3 years from actual symptom onset and 202 asymptomatic noncarriers (shown in green, 406 visits). The vertical dashed line at 0 years represents the expected point of parental symptom onset. Negative EYO values represent the expected preclinical period. Positive values indicate the expected postclinical period. The vertical solid line at −20 years indicates the time point after which the SD of the distribution of CSFp-tau181 levels at 2-year EYO intervals first started to be more than twice greater in pathogenic variation carriers than in noncarriers, according to the method described in (B). The horizontal dashed line indicates the CSFp-tau181 pathology cutoff level (CSFp-tau181 level of 51.52 pg/mL) at 2 SDs from the mean CSFp-tau181 level in asymptomatic noncarriers across the entire EYO range. (B) Cohort 1. Interindividual variability in longitudinal CSFp-tau181 levels, represented as the SD of the CSFp-tau181 levels at 2-year EYO intervals, was plotted against the EYO for pathogenic variation carriers (194 asymptomatic carriers, 21 converters, and 64 symptomatic carriers) and 202 noncarriers. The vertical dashed line at −20 years indicates the time point from which the SD of the CSFp-tau181 distribution at 2-year EYO intervals first started to be more than twice as high in pathogenic variation carriers than noncarriers. Because of the low number of participants with data points located at the extremes of the graph, the SDs of the CSFp-tau181 levels for these participants in the time frame before the −30 EYO and after the +15 EYO were calculated as −35 EYO to −30 EYO (n = 3) and +15 EYO to +28 EYO (n = 15), respectively (additional data in eTable 4). (C) Cohort 2. The process of selecting the representative visit data for exposure and covariate (lifestyle, clinical, and pathology) variables among the multiple visits of individuals. The EYO range in which visits were most frequently and uniformly distributed before onset was −3.04 ± 3.21 EYO. Visit data from 2 outlier individuals (marked with an asterisk) were excluded from the subsequent analysis. (D) Cohort 2. The selected representative visits among multiple visits per participant included in the final analysis. After excluding visit data from 2 outlier participants (marked with an asterisk in Figure 2C), the EYO range in which visits were most frequently and uniformly distributed before onset was −2.45 ± 2.18 EYO. To minimize interindividual variance in EYO time points, we selected the 1 representative visit per participant nearest to the mean EYO (−2.45 EYO) among −2.45 ± 2.18 EYO; the mean of the chosen visits was −1.80 ± 1.08 EYO. The positive outcome group with 15 participants consisted of 11 asymptomatic carriers (purple dots) whose age at the last visit was equal to or greater than the parental age at symptom onset (AAO) and 4 converters (red dots) whose AAO was later than the parental AAO. The negative outcome group with 13 participants consisted of all converters (blue dots).

