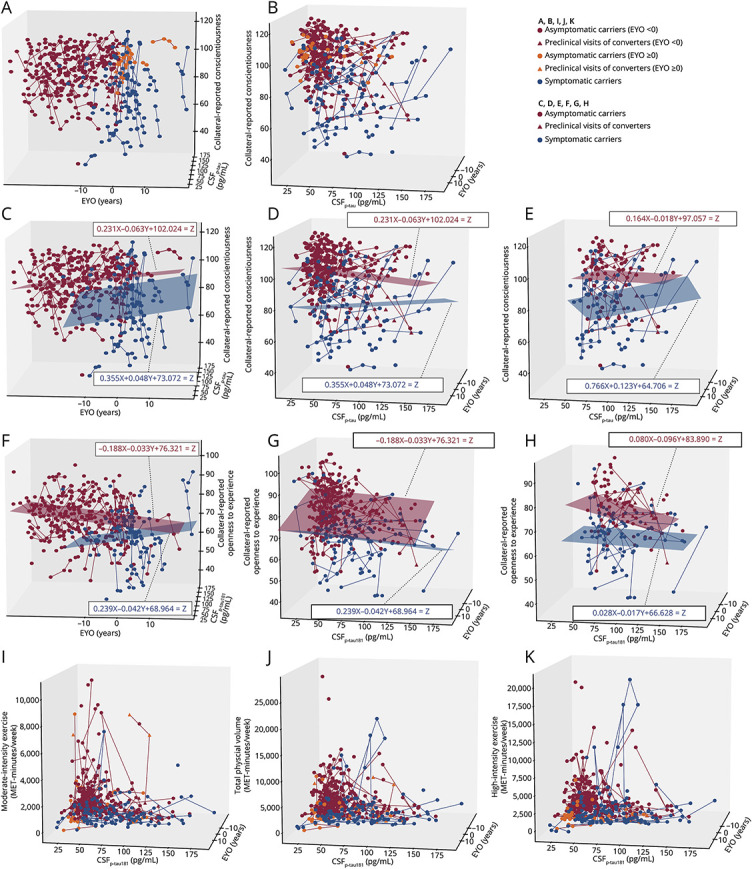
Figure 3. Three-Dimensional Visualization of Within-Individual Longitudinal Trajectories of Modifiable Life Experiences Over Estimated Years From EYO and CSFp-tau181 Levels of the Entire DIAN Cohort According to the Disease Spectrum (A–D, F, G, and I–K) and the Resilience Status (E and H).

(A–E) Visualization of longitudinal collateral-reported conscientiousness over the estimated years from expected symptom onset (EYO) (A, C) and CSFp-tau181 levels (B, D), with an overlaid least-squares best-fitting plane (C, D) of asymptomatic carriers (red) vs symptomatic carriers (blue). X: EYO, Y: CSFp-tau181 levels, Z: collateral-reported conscientiousness. (E) Visualization of longitudinal collateral-reported conscientiousness over CSFp-tau181 levels and EYO in the high-pathology subset (CSFp-tau181 level ≥51.52 pg/mL) according to the resilience status. (F–H) Three-dimensional (3D) visualization of within-individual longitudinal trajectories of collateral-reported openness to experience over EYO (F) and CSFp-tau181 levels (G), with an overlaid least-squares best-fitting plane, according to the disease spectrum and the resilience status (H). In the entire cohort and the subset of participants with high pathology, asymptomatic carriers showed greater overall longitudinal trends of collateral-reported conscientiousness and openness to experience than symptomatic carriers, during the expected preclinical period, as grossly estimated from a higher least-squares best-fitting plane in the conscientiousness or openness to lifestyle-axis direction. (I–K) Three-dimensional (3D) visualization of within-individual longitudinal trajectories of physical activity over CSFp-tau181 levels and EYO of the entire DIAN cohort according to the disease spectrum. (I) Moderate-intensity (MET 3.0–5.9) exercise volume. (J) Total physical activity volume. (K) High-intensity (MET ≥6.0) exercise volume. For moderate-intensity exercise, asymptomatic carriers showed greater overall longitudinal trends in exercise volume than symptomatic carriers, and among asymptomatic carriers, participants with greater moderate-intensity exercise volume trended toward a lower degree of CSFp-tau181 pathology. By contrast, for high-intensity exercise, because some symptomatic carriers had a high volume of high-intensity exercise that was comparable to or even greater than in asymptomatic carriers, there was no significant difference in exercise volume between asymptomatic and symptomatic carriers, as observed for moderate-intensity exercise. Model fitting was performed using the “Best-fit Surfaces for 3-Dimensional Data” code generating least-squared best-fit planes for 3-dimensional data using linear regression techniques (1st-order polynomials), provided by Patrick J. Wright from Inversion Labs (LLC, Wilson, WY; inversionlabs.com/2016/03/21/best-fit-surfaces-for-3-dimensional-data.html). In the 3D plane where the X-axis is the EYO, the Y-axis is the CSF p-tau level, and the Z-axis is the lifestyle data, the mesh grid surface (X_mg, Y_mg) with a 20*20 matrix size was extracted: . Model fitting to estimate the constants (a, b, c) satisfying the least-squares solution for f(x,y) = Z was performed using the scipy.linalg.lstsq function in Python 3.9.12 and consequently produced surface plots with the estimated X_mg, Y_mg, and Z_linear: .
