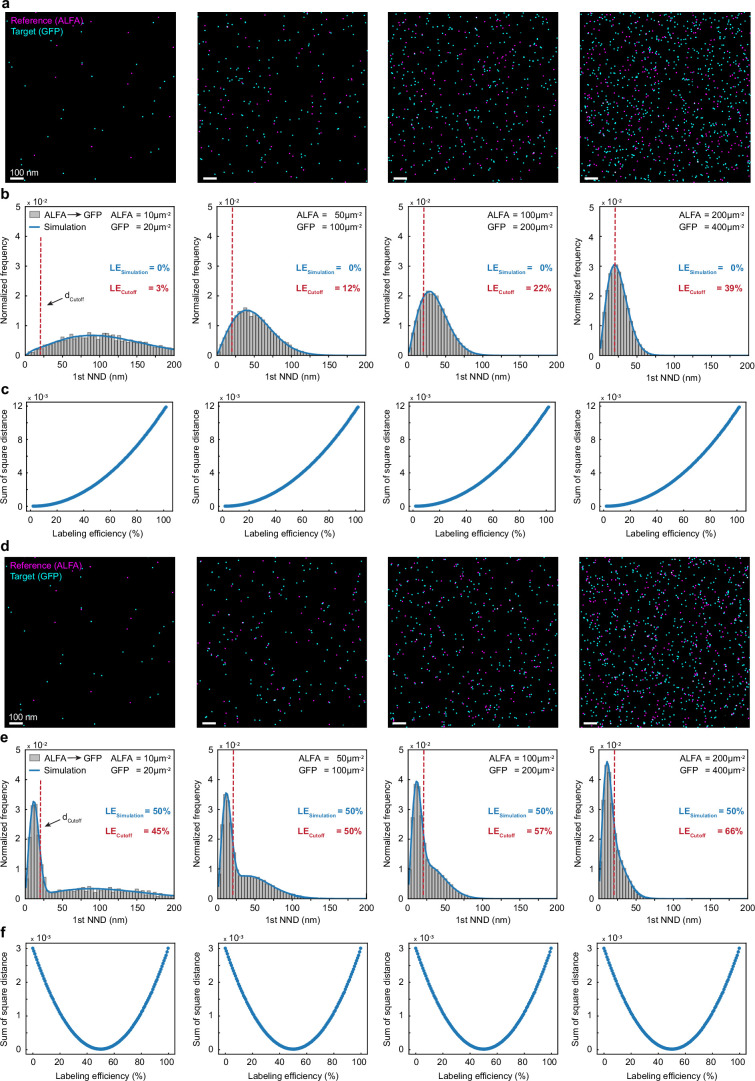
Extended Data Fig. 1. Unbiased determination of labeling efficiency.
Simulated 2-plex Exchange-PAINT image of ALFA-tag nanobody (=Reference, magenta) and GFP nanobody (=Target, cyan) signals at a given labeling efficiency (LE) of either a, 0% or d, 50%. For testing robustness of determined labeling efficiency values, we generated data sets of randomly distributed molecule positions on a 5 µm × 5 µm grid at multiple different densities (ALFA = 10 µm−2, 50 µm−2, 100 µm−2, 200 µm−2; GFP = 20 µm−2, 100 µm−2, 200 µm−2, 400 µm−2). Labeling efficiency is quantified in an unbiased and automated way by determination of cross-nearest neighbor distances (NND) of each reference signal to its nearest target signal (b,e). Individual reference and target molecules as well as colocalizing reference and target molecules for the underlying density were simulated and histograms were generated of all NNDs. The most likely LE is obtained through a least-squares minimization procedure where the sum of the square distances between experimental and simulated data are computed. Blue dots in c and f represent the sum of the square distances for different values of LE, the most likely LE is the one that minimizes such sum, resulting in LE = 0% and L = 50% respectively. Alternatively, LE is determined based on a cutoff distance of 20 nm (red dashed line) which was experimentally determined for ALFA-tag nanobody and GFP nanobody (doffset = 10 nm, 2σ = 10 nm). Note that using a cutoff produces inaccurate results and especially overestimates te LE at higher molecular densities.

