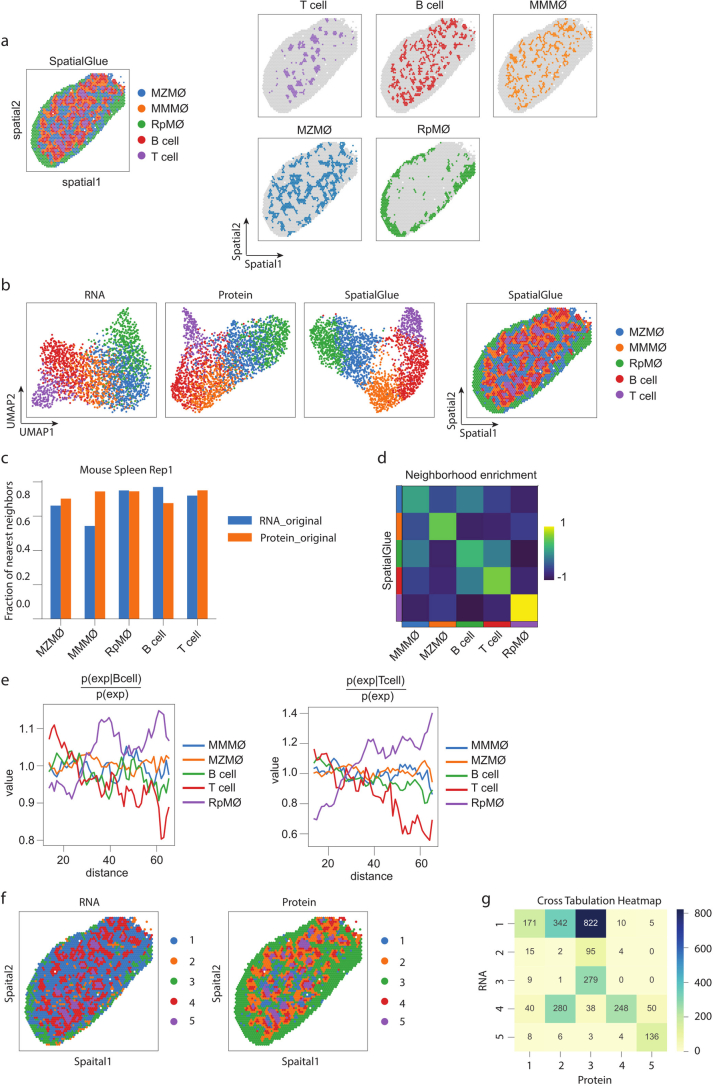
Extended Data Fig. 9. Results for the mouse spleen replicate 1 sample.
(a) Spatial plots of SpatialGlue’s clusters together (left) and separate (right). (b) UMAP plots of the RNA and protein data modalities (left), and spatial plot of SpatialGlue’s clusters (right). (c) Comparison of fraction of nearest neighbors metric for each annotated cluster calculated by the different modalities (original RNA and protein expression). (d) Neighborhood enrichment of cell type pairs. (e) Cluster co-occurrence scores for each cluster at increasing distances. (f) Spatial plots of the RNA and protein data modalities. (g) Cross tabulation heatmap of the clustering labels between the RNA and protein data.

