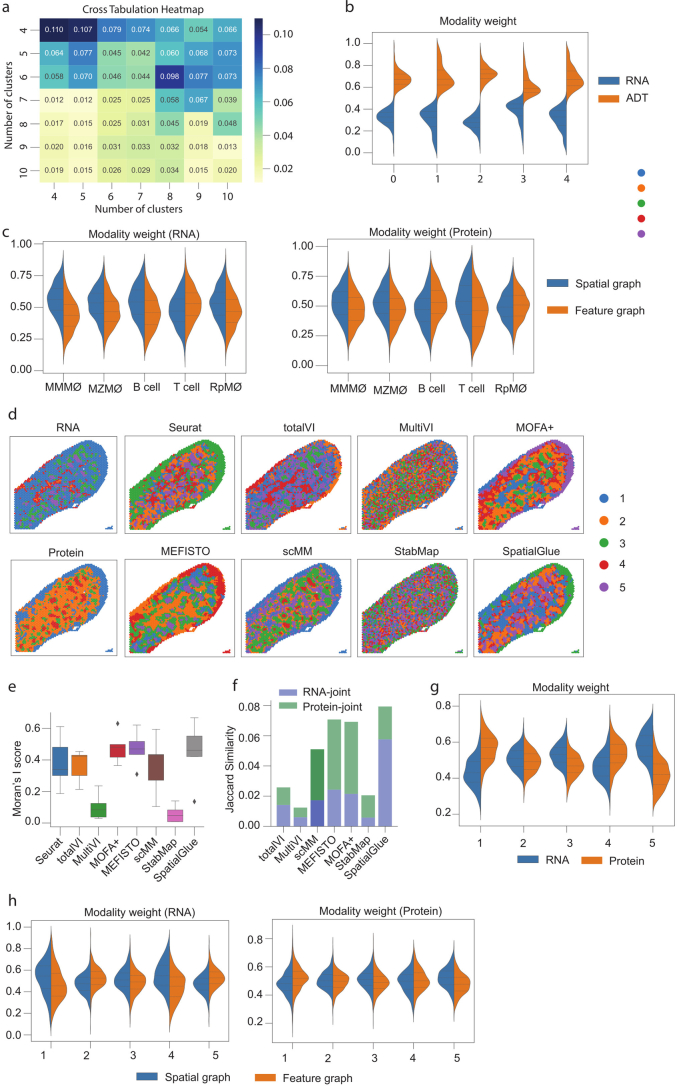
Extended Data Fig. 10. Results for the mouse spleen replicate 1(a-c) and 2(d-h) samples.
(a) Cross tabulation heatmap for the number of clusters between the RNA and protein data. (b) Modality weights from Seurat. (c) Within-modality weights of SpatialGlue explaining the contributions of the spatial and feature graphs to each cluster for each modality. (d) Spatial plots of data modalities with unimodal clustering (left), and clustering results (right) from single-cell and spatial multi-omics integration methods, Seurat, totalVI, MultiVI, MOFA+, MEFISTO, scMM, StabMap, and SpatialGlue. (e) Comparison of Moran’s I score. In the box plot, the center line denotes the median, box limits denote the upper and lower quartiles, and whiskers denote the 1.5× interquartile range. n = 5 clusters. (f) Comparison of Jaccard Similarity scores. (g) Between-modality weight explaining the importance of each modality to each cluster. (h) Within-modality weights explaining the contributions of the spatial and feature graphs to each cluster for each modality.

