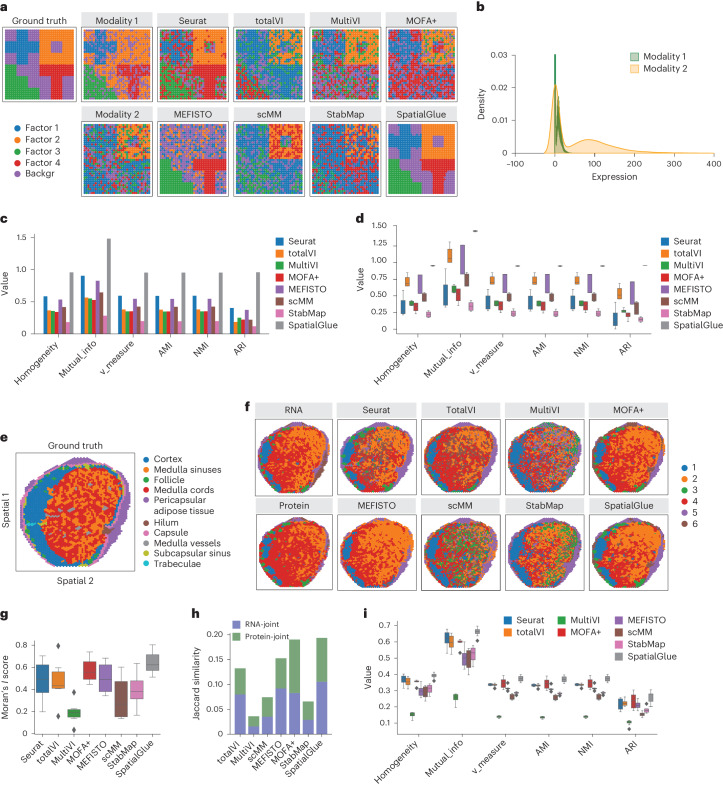
Fig. 2. SpatialGlue accurately identified spatial domains in simulated and real data.
a, Spatial plots of the simulated data, from left to right: ground truth, generated raw data of individual modalities, and clustering results by single-cell and spatial multi-omics integration methods—Seurat, totalVI, MultiVI, MOFA+, MEFISTO, scMM, StabMap and SpatialGlue. ‘backgr’ means background. b, Density distribution of the simulated data modalities. c, Quantitative evaluation of methods with six supervised metrics. d, Box plots of the six metrics with the scores from five simulated datasets. In the box plot, the center line denotes the median, box limits denote the upper and lower quartiles, and whiskers denote the 1.5 times the interquartile range. n = 5 simulated samples. e, Manual annotation of human lymph node sample A1. f, Spatial plots of lymph node sample A1, clustering of individual RNA and protein modalities (left), clustering results (right) from single and spatial multi-omics integration methods—Seurat, totalVI, MultiVI, MOFA+, MEFISTO, scMM, StabMap and SpatialGlue. Note that the colors of clusters do not directly correspond to the same captured structures across different methods. g, Box plots of Moran’s I score of the eight methods. h, Jaccard similarity scores of the eight methods. In the box plot, the center line denotes the median, box limits denote the upper and lower quartiles, and whiskers denote the 1.5 times the interquartile range. n = 6 clusters. i, Box plots of six supervised metrics with scores of clustering results with the number of clusters ranging from 4 to 11. In the box plot, the center line denotes the median, box limits denote the upper and lower quartiles, and whiskers denote 1.5 times the interquartile range. n = 12 clustering results with different resolutions for each method.

