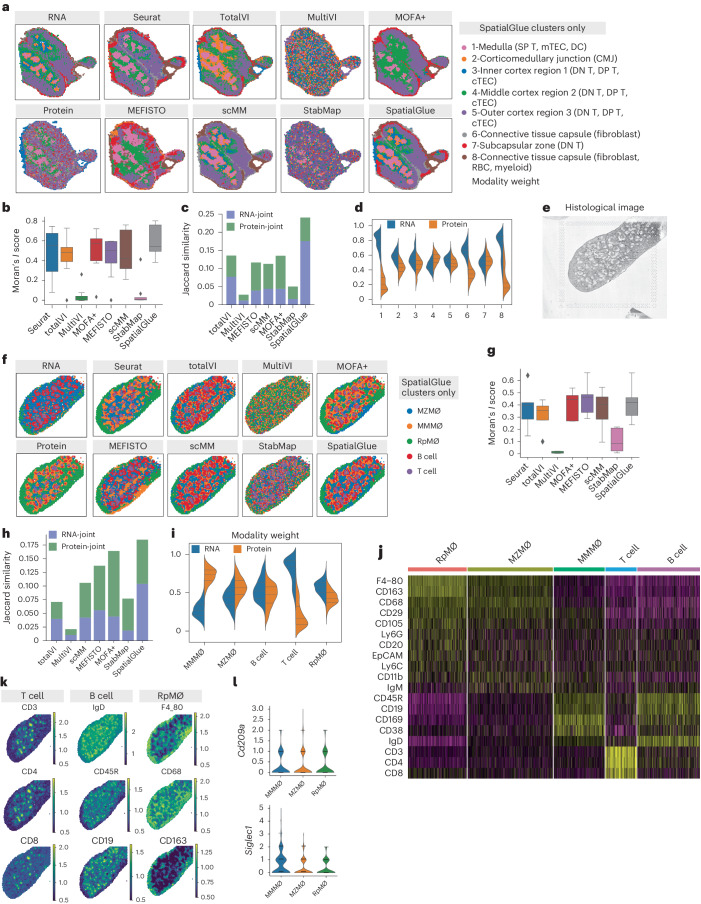
Fig. 4. SpatialGlue accurately integrates multimodal data from the mouse thymus (RNA and protein acquired with Stereo-CITE-seq) and mouse spleen (RNA and protein acquired using SPOTS).
a, Spatial plots of RNA and protein data (mouse thymus acquired with Stereo-CITE-seq) with unimodal clustering (left), and comparison of clustering results (right) from single-cell and spatial multi-omics integration methods—Seurat, totalVI, MultiVI, MOFA+, MEFISTO, scMM, StabMap and SpatialGlue. The annotated labels correspond to SpatialGlue’s results and the clustering colors do not necessarily match to the same structures for the other methods. b, Box plots of Moran’s I score of the eight methods. In the box plot, the center line denotes the median, box limits denote the upper and lower quartiles, and whiskers denote 1.5 times the interquartile range. n = 8 clusters. c, Comparison of Jaccard similarity scores of the eight methods. d, Modality weights of different modalities, denoting their importance to the integrated output of SpatialGlue. e, Histology image of the mouse spleen replicate 1 sample. f, Spatial plots RNA and protein data (mouse spleen acquired using SPOTS) with unimodal clustering (left), and clustering results (right) from single-cell and spatial multi-omics integration methods—Seurat, totalVI, MultiVI, MOFA+, MEFISTO, scMM, StabMap and SpatialGlue. RpMΦ, MMMΦ and MZMΦ are red pulp macro, CD169 + MMM and CD209a+ MZM, respectively. The annotated labels correspond to SpatialGlue’s results and the clustering colors do not necessarily match to the same structures for the other methods. g, Box plots of Moran’s I score of the eight methods. In the box plot, the center line denotes the median, box limits denote the upper and lower quartiles, and whiskers denote 1.5 times the interquartile range. n = 5 clusters. h, Comparison of Jaccard similarity scores of the eight methods. i, Modality weights of different modalities, denoting their importance to the integrated output of SpatialGlue. j, Heat map of differentially expressed ADTs for each cluster. k, Normalized ADT levels of key surface markers for T cells (CD3, CD4, CD8), B cells (IgD, B220, CD19) and RpMΦ (F4_80, CD68, CD163). l, Violin plots of two marker genes in the MMMΦ, MZMΦ and RpMΦ clusters.

