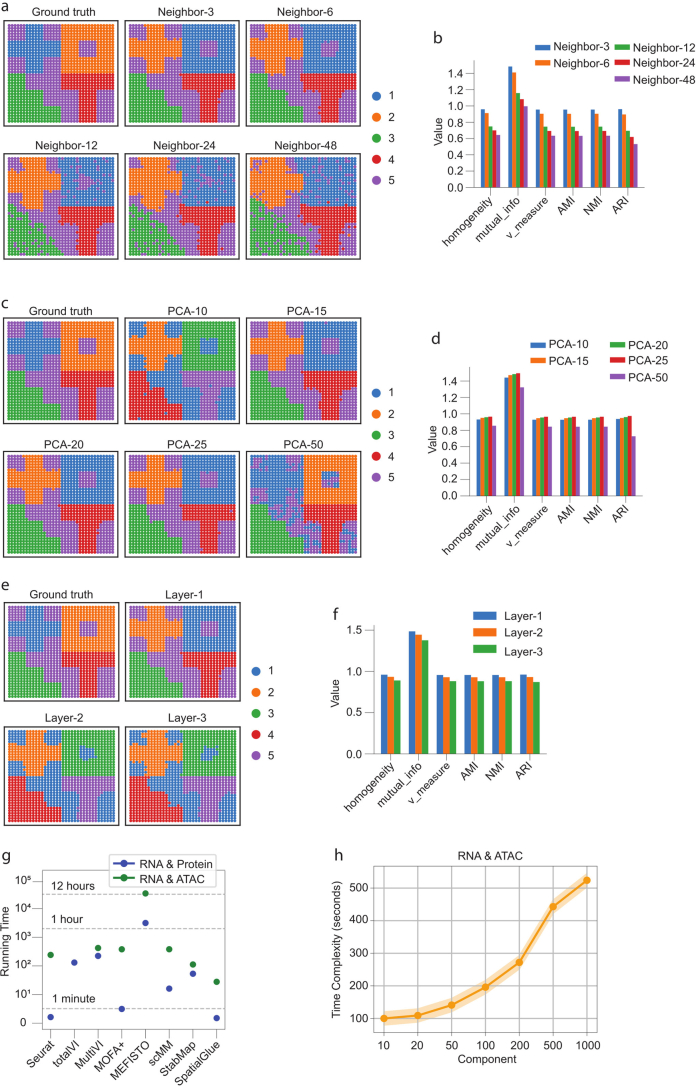
Extended Data Fig. 1. Analysis of parameter sensitivity and time complexity with simulated and real data.
(a) Comparison of clustering results with different numbers of neighbors k to illustrate SpatialGlue’s sensitivity to parameters. (b) Supervised metrics on the clustering results. (c) Comparison of clustering results with different number of PCs to illustrate SpatialGlue’s sensitivity to input dimensionality. (d) Supervised metrics on the clustering results. (e) Comparison of clustering results with different numbers of GNN layers to illustrate SpatialGlue’s sensitivity to input dimensionality. (f) Supervised metrics on the clustering results. (g) Time complexity of SpatialGlue and competing methods (Seurat, totalVI, MultiVI, MOFA+, MEFISTO, scMM, StabMap). In the experiment, we used murine spleen dataset with 4,697 spots for RNA & Protein data, and mouse brain RNA ATAC P22 with 9,215 cells for RNA & ATAC data. (h) Time complexity of SpatialGlue with various principal components as inputs on mouse brain RNA ATAC P22.

