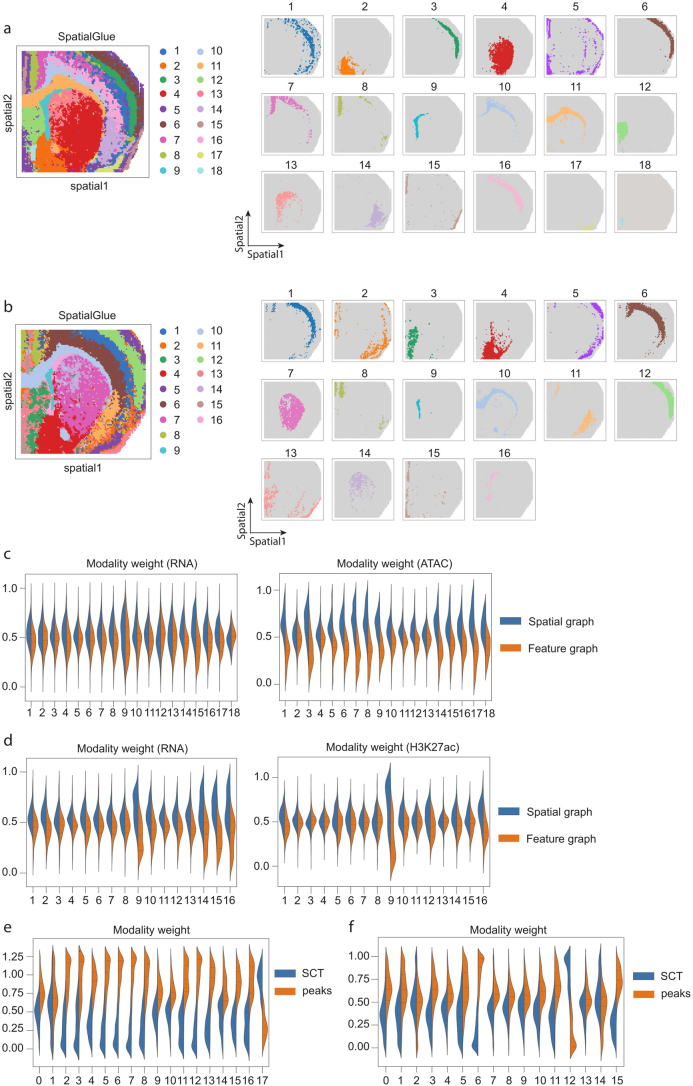
Extended Data Fig. 4. Additional results of the mouse brain P22 samples (spatial-ATAC-RNA-seq and spatial-CUT&Tag-RNA-seq, H3K27ac).
(a) Separate spatial plots of all clusters identified by SpatialGlue in the mouse brain P22 sample (spatial-ATAC-RNA-seq). (b) Separate spatial plots of all clusters identified by SpatialGlue in the mouse brain P22 sample (spatial-CUT&Tag-RNA-seq, H3K27ac). (c) Within-modality weights for the RNA and ATAC modalities explaining the importance of the spatial and feature graphs to each cluster. (d) Within-modality weights for the RNA and CUT&Tag (H3K27ac) modalities explaining the importance of the spatial and feature graphs to each cluster. (e) Modality weights of Seurat when applied to the spatial-ATAC-RNA-seq P22 sample. (f) Modality weights of Seurat when applied to the spatial-CUT&Tag-RNA-seq (H3K27ac) sample.

