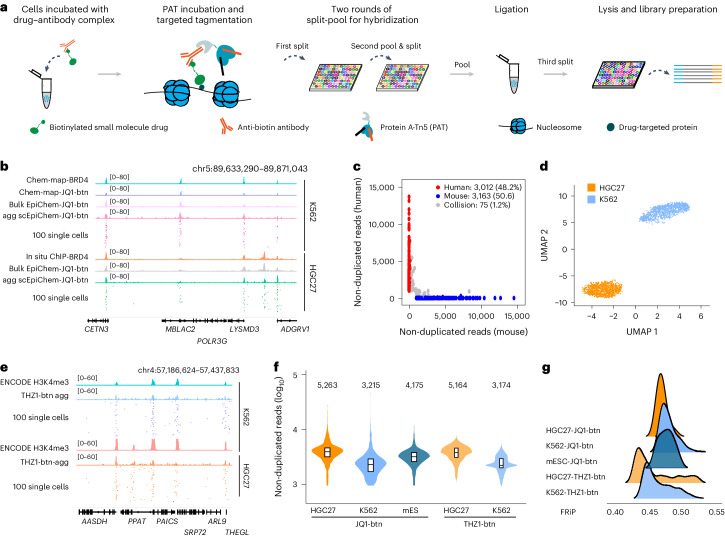
Fig. 1. Single-cell EpiChem profiling of genomic binding sites of small-molecule drugs.
a, Schematic of single-cell EpiChem design. b, Track view displaying JQ1-btn signals in K562 and HGC27 cells at the representative loci. Genomic tracks of JQ1-btn binding in bulk level (JQ1-btn), single cell aggregate (JQ1-btn agg) and randomly selected 100 single cells alongside those of related proteins were presented. Chem-map data were downloaded from GSE209713. c, Scatter-plot of the human–mouse species mixing test using JQ1-btn signals. Points are colored by the cell identity as human (red, >95% of reads mapping to hg19) and mouse (blue, >95% of reads mapping to mm10) or collision (gray, 5% to 95% of reads mapping to either genome). d, UMAP visualization showing K562 (n = 2,000) and HGC27 cells (n = 2,000) colored by cell types, based on JQ1-btn signals. e, Track view displaying THZ1-btn signals in K562 and HGC27 cells at the representative loci. Genomic tracks of small-molecule genomic bindings at bulk level (THZ1-btn), single cell aggregate (THZ1-btn agg) and randomly selected 100 single cells alongside those of related proteins were presented. f, Violin plot showing non-duplicated reads per cell of JQ1-btn and THZ1-btn of K562 (n = 2,000), HGC27 (n = 2,000) and mES cells (n = 2,000). Numbers on the top of violin plot indicate the median value. g, Ridge plot showing the FRiP of JQ1-btn, THZ1-btn in K562, HGC27 and mES cells.

