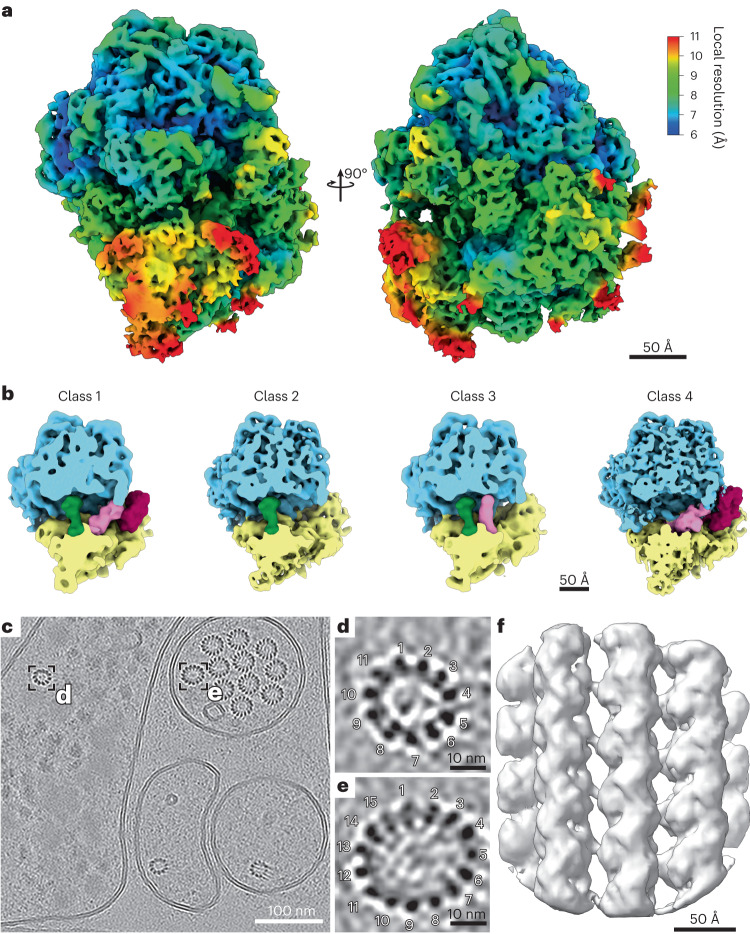
Fig. 5. Subtomogram average reconstruction of the C. elegans 80S ribosome and the 11-protofilament microtubule from in situ data.
a, The C. elegans ribosome reconstructed by subtomogram averaging to a resolution of 6.9 Å (GSFSC). The density map is colored by local resolution. Note that protein α-helices and ribosomal RNA helices are clearly visible at this resolution. b, Four different ribosomal states were obtained through subtomogram classification: ribosome class 1 with occupied A, P and EF sites, ribosome class 2 with an occupied P site, ribosome class 3 with occupied A and P sites, ribosome class 4 with occupied A and EF sites. c, Tomographic slice of a tomogram collected from, what is likely, the ventral sublateral nerve cord with a touch-receptor neuron (PLML/R). Boxes highlight two different C. elegans microtubule assemblies made up of 11 and 15 protofilaments. d, Magnified tomogram section of the 11-protofilament microtubule from a hypodermal cell highlighted in c. e, Magnified tomogram section of the 15-protofilament microtubule from the touch-receptor cell highlighted in c. f, Subtomogram average of a focused region of the 11-protofilament microtubules resolved to 13 Å. Data presented in a and b stem from experiment 2; data presented in c–f stem from experiment 3.

