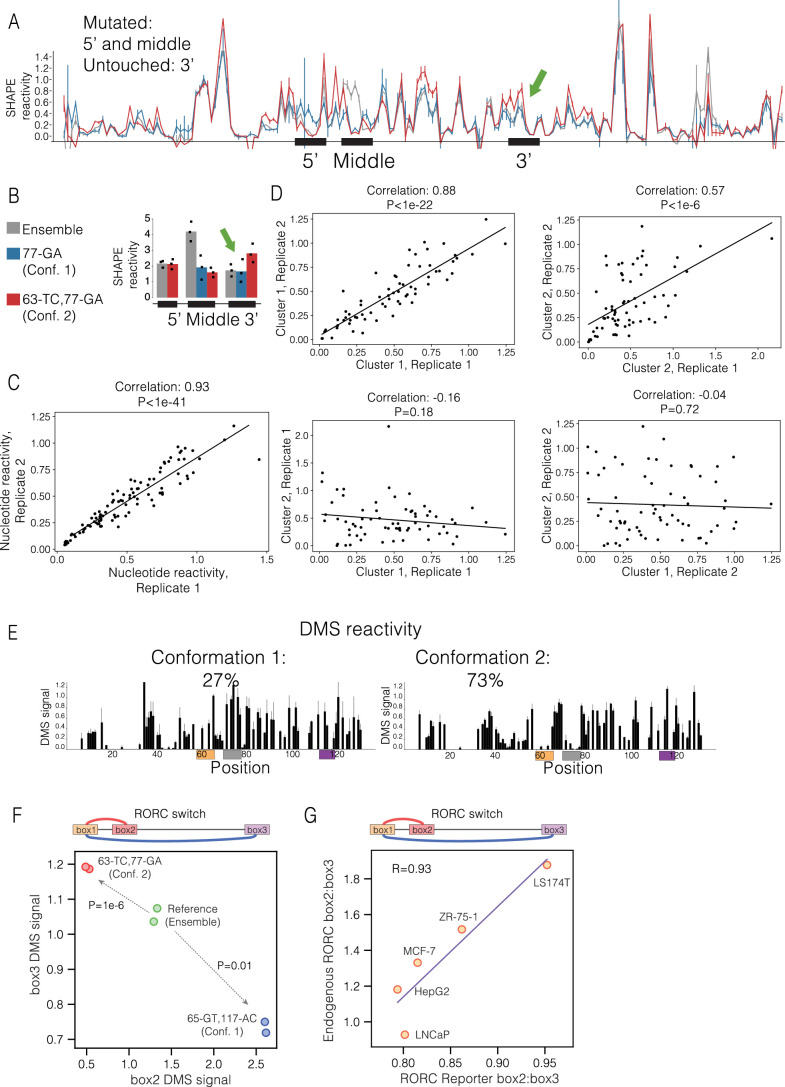
Extended Data Fig. 3. In vitro SHAPE reactivity of the RORC RNA switch sequence in vitro.
a SHAPE reactivity profiles for the reference sequence and for the mutation–rescue pair of sequences (blue - ‘77-GA’, red - ‘63-TC,77-GA’). Shown is the average for 3 replicates with the respective error bars (SD). The SHAPE reactivity changes in the nonmutated regions are highlighted in bold arrows. b Barplots of cumulative SHAPE reactivity within the switching regions for the reference sequence (in gray) and for the mutation–rescue pair of sequences (blue - ‘77-GA’, red - ‘63-TC,77-GA). N replicates = 3. c Scatter plot showing the reproducibility of the DMS signal between two replicates. Each dot represents a single nucleotide. Normalized DMS signal is shown on both axes. Correlation and P value is determined with Pearson correlation coefficient (P = 1.59-42). d Scatter plots showing the reproducibility of the DRACO clusters between replicates (N = 2). Each replicate’s reads were clustered with DRACO, the DMS reactivity was calculated for each cluster; the clusters were subsequently matched between replicates. Shown are DMS reactivities for a given cluster in a given replicate; each dot represents a single nucleotide. Correlation and P value is determined with Pearson correlation coefficient. P values left to right: 2.60e-23,3.62e-07,0.18,0.73. e DMS reactivities of the two clusters identified by the DRACO unsupervised deconvolution algorithm (Morandi et al. 28). The algorithm was run on two replicates independently, and identified the same clusters in both of them. The ratios of the clusters reported by DRACO are 22% to 78% in replicate 1 and 32% to 68% in replicate 2. The ratio shown is an average between the two replicates. The switching regions are shown in color. f The effect of sequence mutations in the ‘Box 2’ and ‘Box 3’ regions of RORC element on their reactivity, as measured by DMS-MaPseq in a reporter cell line. P values were determined using the two-sided independent T-test. g Correlation of relative proportions of the two conformations between the reporter context and the endogenous RORC mRNA. Linear regression is shown with a line. The relative conformations’ proportion is defined as the ratio of reactivities of Box 2:Box 3.

