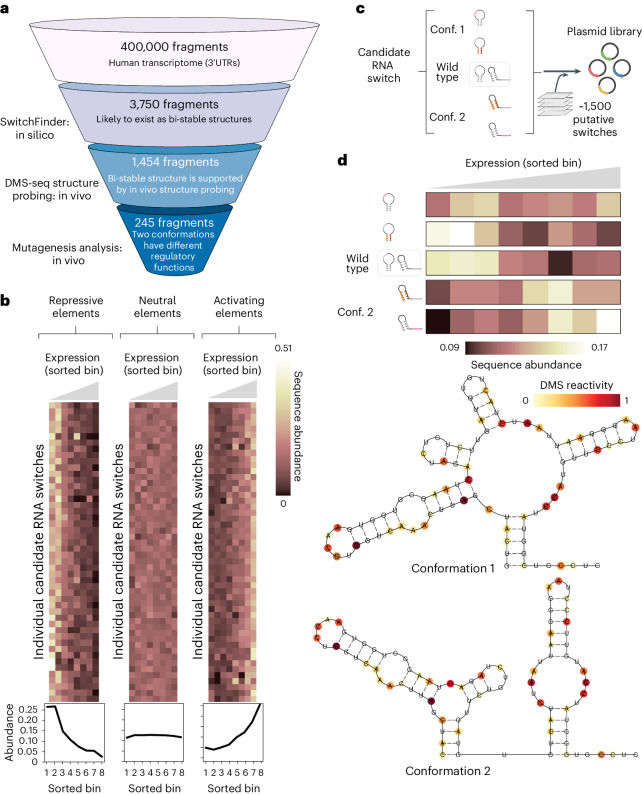
Fig. 2. MPRA captures the functional difference between the conformations of candidate RNA switches.
a, Overview of SwitchSeeker, the platform for RNA switch identification, applied to the 3ʹUTRs of the human transcriptome. b, Examples of regulatory elements identified by the functional screen. Each row represents a single candidate RNA switch, each column represents a single bin defined by the reporter gene expression (eGFP fluorescence, normalized by mCherry fluorescence). Bin 1 corresponds to the cells with the lowest eGFP fluorescence, bin 8 corresponds to the highest. The value in each cell is the relative abundance of the given RNA switch in the given bin, normalized across the eight bins. The three plots show examples of candidate switches with repressive, neutral and activating effects on gene expression. The plots below show cumulative sequence abundances across all of the candidate switches in each group. c, The set-up of the massively parallel mutagenesis analysis. For each candidate RNA switch, we design four mutated sequence variants. Two of them lock the switch into conformation 1, and the other two lock it into conformation 2. A sequence library is then generated (Extended Data Fig. 2d), in which each candidate RNA switch is represented by the four mutated sequence variants, along with the reference sequence. d, Example of a high-confidence candidate RNA switch identified using the massively parallel mutagenesis analysis. Bottom: Two alternative conformations as predicted by SwitchSeeker. The RNA secondary structure probing data collected with the Structure Screen is shown in color. The Gibbs free energy difference between the two predicted conformations is 2.4 kcal per mol. Top: The effect of the candidate RNA switch locked in one or another conformation on reporter gene expression. Each row corresponds to a single sequence variation that locks the RNA switch into one of the two conformations. Each column represents a single bin defined by the reporter gene expression. The value in each cell is the relative abundance of the given RNA switch in the given bin, normalized across the eight bins.

