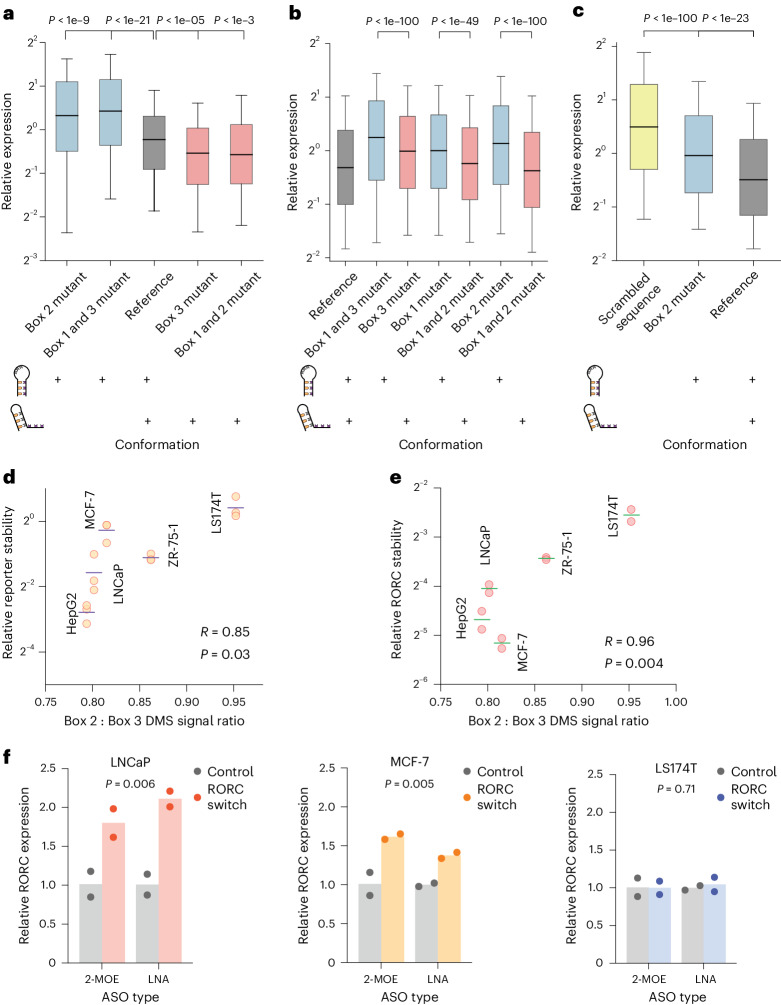
Fig. 5. The two alternative conformations of the RORC RNA switch have opposing effects on target gene expression.
a–c, Box plots of the relative expression of the reporter construct across different RNA conformations and sequences in HEK293 cells (a), reciprocal mutations (b) and primary Th17 cells (c). Relative expression is quantified as the ratio of eGFP to mCherry fluorescence for individual cells, as measured by flow cytometry (n = 10,000 cells). The boxes shows the quartiles of the dataset, with the central line indicating the median value; the whiskers extend from the 10th to the 90th percentile. The colors denote specific RNA conformations or sequences: conformation 1 in blue, conformation 2 in red, reference sequence in gray, and a scrambled sequence in yellow. The diagrams below the box plots show the balance of the two conformations in the RNA populations, with existing conformations marked by a ‘+’ sign. Statistical significance was determined with a two-sided independent t-test. a, The mutations left to right: 73-CCCTATGA; 61-TATATAA,116-TTATATA; reference; 116-CCCTAAG; 62-GCACAGT,73-ACTGTGC. P values left to right: 1.1e−10, 2.6e−22, 1.6e−06, 0.00025. b, Effect of the shift in equilibrium between two conformations of the RORC switch on reporter gene expression for reciprocal mutations. The mutation–rescue experiments were performed as shown in Fig. 3b. The mutations left to right: reference; 65-GT,117-AC; 117-AC; 66-AC; 66-AC,74-GT; 77-GA; 63-TC,77-GA. P values left to right: 7.1e−117, 3.6e−50, 5.9e−260. c, Effect of shift in the equilibrium between two conformations of the RORC switch on reporter gene expression in primary Th17 T cells. Human CD4+ T cells were infected with lentiviral constructs carrying one of the three sequences in the reporter gene’s 3ʹUTR, and subsequently differentiated into Th17 cells. The mutations left to right: scrambled RORC RNA switch; 77-GA; reference. P values left to right: 1.7e−124, 2.6e−24. d,e, Scatterplots of the relationship between the relative conformation ratio of the RORC element, as measured with DMS-MaPseq in reporter-expressing cell lines, and stability of the reporter mRNA (n = 3 replicates) (d) and the endogenous RORC mRNA (n = 2 replicates) (e), as measured by RT-qPCR following the α-amanitin treatment. The reporter contains the eGFP ORF, followed by the 3ʹUTR containing the RORC RNA switch sequence. Horizontal lines represent the mean of mRNA stability. Correlation of mean stability and the relative conformational ratio was measured using the Pearson correlation coefficient. f, Effect of ASOs on endogenous RORC mRNA expression, as measured by RT-qPCR. The targeting ASOs are complementary to Box 2 of the RNA switch; the control ASOs have the same nucleotide composition as the targeting ones but do not target the RORC RNA switch sequence. P values were determined using the two-sided independent t-test, comparing the RORC-targeting and control ASOs, independent of the ASO chemistry. n = 2 replicates. LNA, locked nucleic acids.

