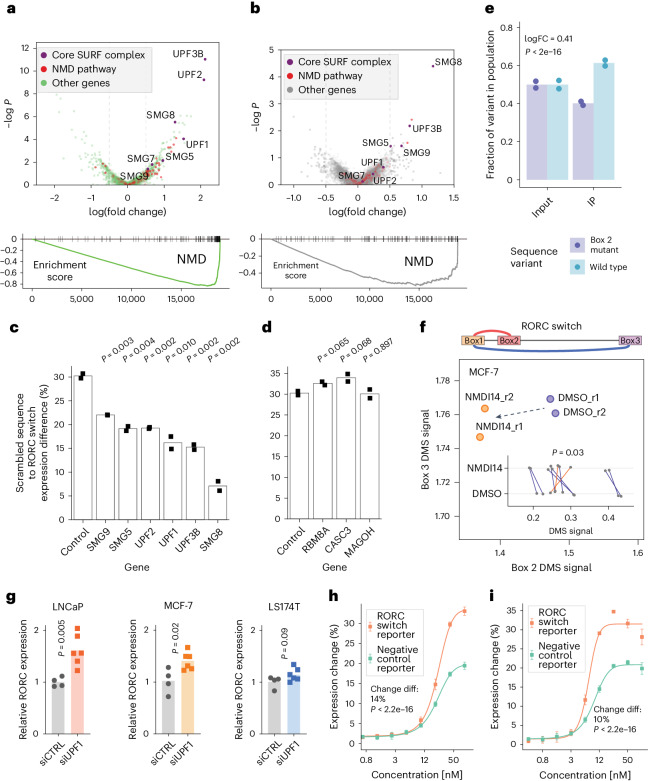
Fig. 6. Genome-wide CRISPRi screen identifies SURF complex as acting downstream of the RORC RNA switch.
a, Top: Expression change: high versus low: comparison of sgRNA representation between the bottom and the top quantiles of reporter gene expression (across both reference and 77-GA mutant cell lines), represented as a volcano plot. Genes, annotated as part of the NMD pathway by gene ontology (GO), are colored in red. The core components of the canonical NMD pathway are colored in purple and labeled. All other genes are colored in green. Bottom: Gene set enrichment analysis (GSEA) plot for the NMD pathway for the above comparison. −logP: negative logarithm of P value. b, Differences between conformations: wild type versus the 77-GA mutant. Comparison of ratios between top and bottom expression quantiles for the two cell lines. Higher values on the x axis indicate that sgRNAs targeting this gene have a stronger effect on reporter gene expression in the reference cell line compared with the 77-GA mutant cell line. Top: ‘ratio of ratios’ comparison57 represented as a volcano plot. Genes are colored as in a. Bottom: GSEA plot for the NMD pathway for the above comparison. −logP: negative logarithm of P value. c,d, The effect of knockdown of SURF (c) and EJC (d) member proteins on the RORC RNA switch reporter gene expression, relative to a scrambled sequence. The individual genes were knocked down using the CRISPRi system in both the reference and the scrambled cell lines, then the change of reporter gene expression was measured using flow cytometry (n = 2 replicates). The bar plots show the ratio of the expression of the scrambled sequence to that of the wild-type sequence of the RORC RNA switch. P values were calculated using the two-sided Student’s t-test. e, Bar plots of the fractions of reads carrying the wild-type RORC switch sequence or B77-GA mutant variant in the UPF1 cross-linking and immunoprecipitation (CLIP) library. Left: input RNA libraries, extracted from the wild-type and 77-GA mutant-expressing Jurkat cells, mixed at a 1:1 ratio. Right: libraries after anti-UPF1 immunoprecipitation (IP). The fractions are normalized by the variant fractions in the input libraries. The P value was calculated using the translation efficiency ratio test58. FC, fold change. n = 2 replicates. f, The effect of NMDI14 on the accessibility of the Box 2 and the Box 3 regions of the RORC element, as measured by DMS-MaPseq. Changes in individual nucleotide accessibility are shown on the inner plot. Statistical significance was determined using a two-sided independent t-test. g, The effect of UPF1 knockdown on endogenous RORC mRNA expression, as measured by RT-qPCR (control, n = 4 replicates; UPF1 knockdown, n = 6 replicates). siCTRL, non-targeting dicer-substrate small interfering RNA; siUPF1, UPF1-targeting dicer-substrate small interfering RNA. P values were calculated using the two-sided Student’s t-test. h,i, Effect of the proteasome inhibitors carfilzomib (h) and bortezomib (i) on the RNA switch-mediated expression change (n = 4 replicates). Data are given as the mean ± s.d. Statistical significance was determined using dose–response modeling followed by ANOVA, to compare the fitted models to assess differences in the effect of the inhibitors on the RNA switch-mediated expression.

