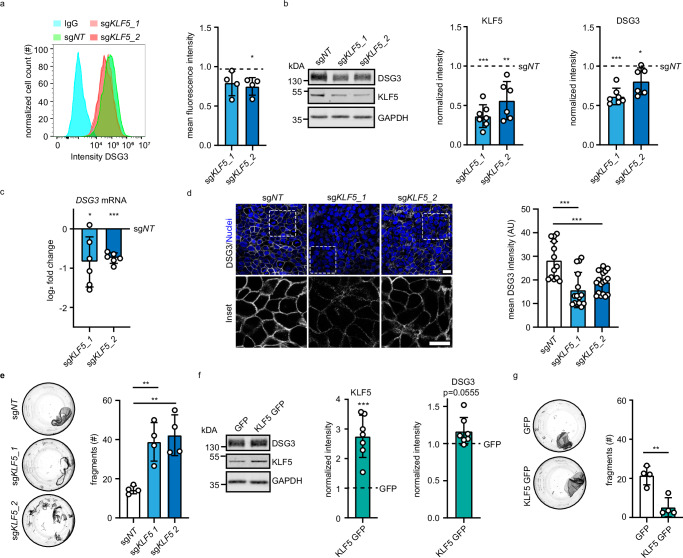
Fig. 2. KLF5 modulates DSG3 protein levels and cell–cell adhesion.
a Flow cytometry analysis of HaCaT cells stained with anti-DSG3 antibodies or IgG as control. HaCaT cells were transduced with sgNT, sgKLF5_1 (p = 0.0698), or sgKLF5_2 (p = 0.0206). A representative histogram and mean fluorescence intensity of four independent experiments are displayed. b Western blot analysis of HaCaT cell lysates using KLF5, DSG3, and GAPDH antibodies. HaCaT cells were stably transduced with sgNT, sgKLF5_1, or sgKLF5_2. Representative Western blot images and quantifications of the respective proteins are shown; sgKLF_1 (p = 0.0005, n = 7), sgKLF5_2 (p = 0.0023, n = 6). Values were normalized to sgNT. c Quantitative Real-time PCR analysis of DSG3 of mRNA extracted from HaCaT cells stably transduced with sgNT, sgKLF5_1, or sgKLF5_2. Values were normalized to sgNT. n = 6, sgKLF5_1 p = 0.0235; sgKLF5_2 p < 0.0001. d Immunofluorescence staining of HaCaT cells stably transduced with sgNT, sgKLF5_1 or sgKLF5_2 using DSG3 antibodies and DAPI as nuclear stain (n = 3, sgKLF5_1 p < 0.0001, sgKLF5_2 p = 0.0009). Representative pictures are shown. Scale bar = 10 μm. e Dispase-based dissociation assay of HaCaT cells stably transduced with sgNT, sgKLF5_1, or sgKLF5_2 (n = 4, sgKLF5_1 p = 0.0046; sgKLF5_2 p = 0.0020). Representative images and the number of fragments are shown. f Western blot analysis of HaCaT cell lysates stably overexpressing KLF5 using KLF5, DSG3, and GAPDH antibodies. Representative Western blot images and quantifications of respective proteins (n = 7, KLF5 p = 0.0006, DSG3 p = 0.0555), are shown. g Dispase-based dissociation assay of HaCaT cells stably overexpressing KLF5 (n = 4, p = 0.0031). Representative images and the number of fragments are shown. Values expressed as mean with standard deviation (mean ± SD). One n represents one biological replicate. Source data are provided as a Source Data file. Experiments (a–c, f) were analyzed with one-sample t-test (two-sided), (d, e) were analyzed with One-way-ANOVA, SIDAK correction. g was analyzed with student’s t-test (two-sided). p < 0.05*; p < 0.01**; p < 0.001***.

