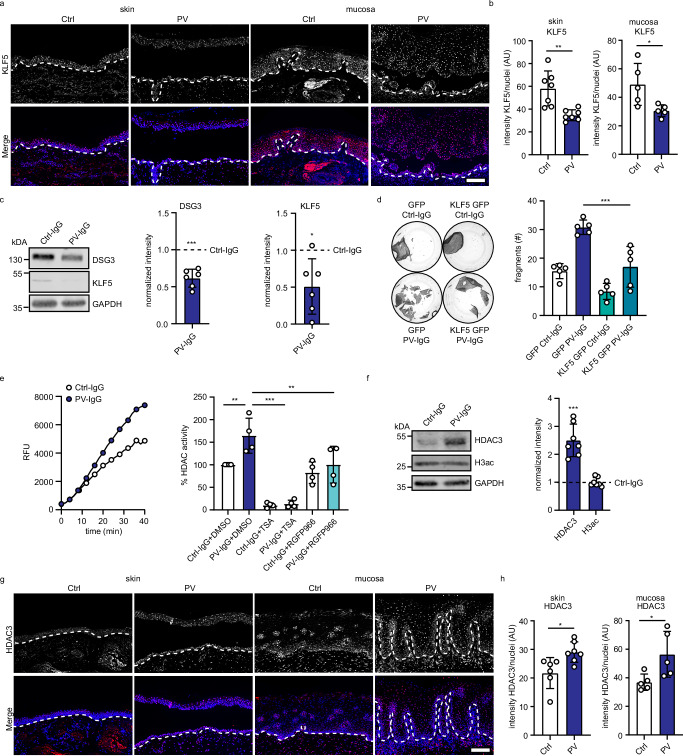
Fig. 3. KLF5 is downregulated in pemphigus vulgaris (PV).
a Immunofluorescence staining of human skin or mucosa sections from healthy controls or PV biopsies using KLF5 antibodies and DAPI. Representative images of one individual patient and control are shown. Scale bar = 100 μm. b Quantification of (a) displaying the mean intensity of KLF5 per nucleus (skin n = 7 p = 0.0023, mucosa n = 5 p = 0.0270). c Western blot analysis of HaCaT cells treated with Ctrl-IgG or PV-IgG for 24 h using KLF5, DSG3, and GAPDH antibody. Representative Western blot images and quantifications of respective proteins (n = 6, DSG3 p = 0.0006, KLF5 p = 0.0238) are shown. Values were normalized to Ctrl-IgG. d Dispase-based dissociation assay of HaCaT cells stably transduced with GFP or KLF5-GFP (n = 5, GFP PV-IgG vs KLF5-GFP PV-IgG p < 0.0001). Representative images and the number of fragments are shown. e HDAC activity assay using HaCaT cell lysates. HaCaT cells were treated with Ctrl-IgG or PV-IgG including DMSO, 1 μM trichostatin A (TSA), or 5 μM RGFP966 for 24 h. The left panel shows the increase in deacetylated peptide detected by its fluorophore (expressed by RFU relative fluorescence units) over time of a representative experiment and the right panel shows the calculated HDAC3 activity (n = 4, Ctrl-IgG+DMSO vs PV-IgG DMSO p = 0.0061, PV-IgG DMSO vs PV-IgG TSA p < 0.0001, PV-IgG DMSO vs PV-IgG RGFP966 p = 0.0063). f Western blot analysis of HaCaT cell lysates using HDAC3, H3ac, and GAPDH antibodies. HaCaT cells were treated with Ctrl-IgG or PV-IgG for 24 h. Representative Western blot images and quantifications of respective proteins (n = 7, HDAC3 p = 0.0005, H3ac p = 0.7207) are shown. Values were normalized to Ctrl-IgG. g Immunofluorescence staining of human skin or mucosa sections from healthy controls or PV biopsies using HDAC3 antibodies and DAPI. Representative images of individual patients and controls are shown. Scale bar = 100 μm. h Quantification of (g) displaying the mean intensity of HDAC3 per nucleus (skin n = 7 p = 0.0139, mucosa n = 5 p = 0.0335). Values expressed as mean with standard deviation (mean ± SD). One n represents one biological replicate. Source data are provided as a Source Data file. Experiments (d) and (e) were analyzed with One-way-ANOVA, SIDAK correction. b, h were analyzed with two-sided students t-test, and c, f were analyzed with one-sample t-test. p < 0.05*; p < 0.01**; p < 0.001***.

