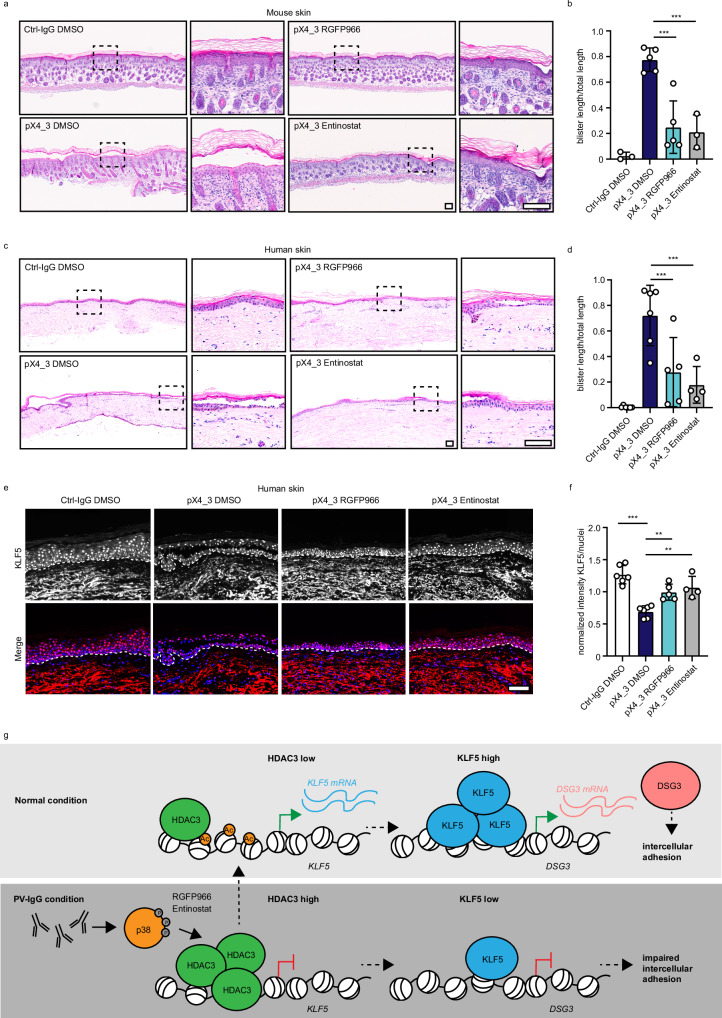
Fig. 6. HDAC3 inhibition ameliorates PV phenotype in vivo.
a Passive transfer neonatal mouse model: H&E staining of mouse skin injected with Ctrl-IgG or pX4_3 and DMSO/ 5 μM RGFP966 or 10 μM Entinostat is displayed. Scale bar = 100 μm. b Quantification of blister length versus total section length is shown (Ctrl-IgG DMSO n = 3, pX4_3 DMSO n = 5, pX4_3 RGFP966 n = 5, pX4_3 Entinostat n = 3, pX4_3 DMSO vs pX4_3 RGFP966 p = 0.0001, pX4_3 DMSO vs pX4_3 Entinostat p = 0.0003). c Ex vivo human skin model: H&E staining of skin explants injected with Ctrl-IgG or pX4_3 and DMSO/ 5 μM RGFP966 or 10 μM Entinostat is displayed. Scale bar = 100 μm. d Quantification of blister length versus total section length is shown (Ctrl-IgG DMSO n = 6, pX4_3 DMSO n = 6, pX4_3 RGFP966 n = 5, pX4_3 Entinostat n = 4, pX4_3 DMSO vs pX4_3 RGFP966 p = 0.0003, pX4_3 DMSO vs pX4_3 Entinostat p < 0.0003). e Immunofluorescence staining of human skin sections with Ctrl-IgG or pX4_3 and DSMO/ 5 μM RGFP966 or 10 μM Entinostat injection using KLF5 antibodies and DAPI. Representative images are shown. Scale bar = 100 μm. f Quantification of (e) displaying the mean of intensity of KLF5 per nucleus normalized to the average signal intensity within each experiment (Ctrl-IgG DMSO n = 6, pX4_3 DMSO n = 6, pX4_3 RGFP966 n = 5, pX4_3 Entinostat n = 4, Ctrl-IgG DMSO vs pX4_3 DMSO p < 0.0001, pX4_3 DMSO vs pX4_3 RGFP966 p = 0.0046, pX4_3 DMSO vs pX4_3 Entinostat p = 0.0012). h Schematic of the results. Values expressed as mean with standard deviation (mean ± SD). One n represents one biological replicate. Source data are provided as a Source Data file. All experiments were statistically analyzed with One-way-ANOVA, SIDAK correction. p < 0.01**; p < 0.001***.

