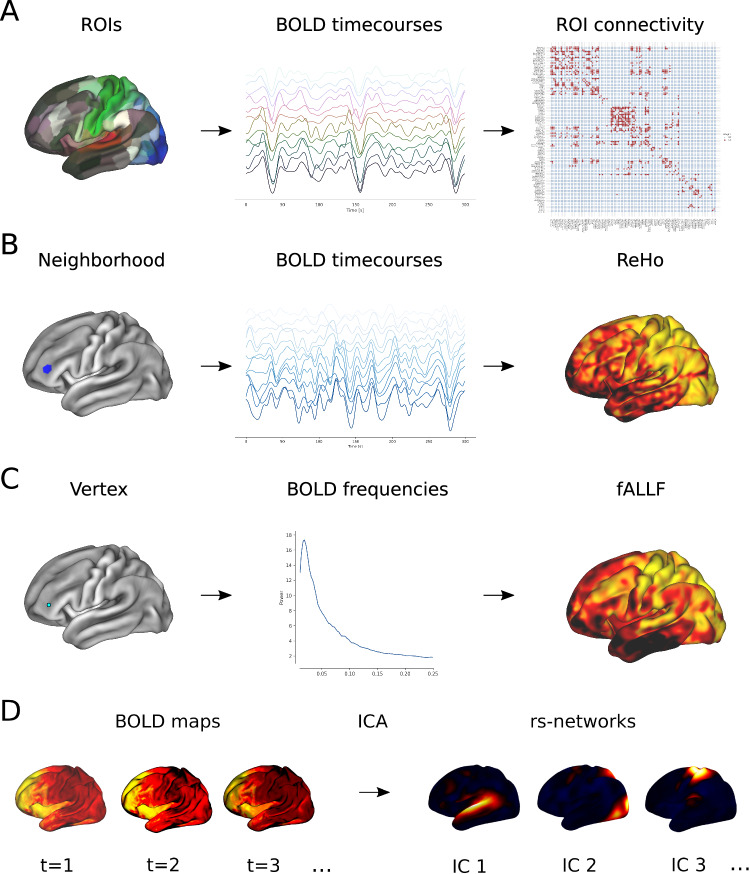
Fig. 1. Analysis strategies used in our study to characterize activity dynamics in rs-fMRI.
A illustrates how resting-state FC between different ROIs was computed. We used an atlas to subdivide the cortex into segregated ROIs and correlated the average BOLD time courses within each ROI, yielding a functional connectivity matrix. Using different graph theoretical measures allowed us to analyze changes of the region-wise or whole-brain connectivity. B shows how ReHo maps were derived from rs-fMRI data. For each vertex on the surface the neighbouring vertices within a pre-defined radius were selected to define a local neighbourhood (marked in blue in this example). By computing the similarity between all time courses within this neighbourhood, we obtained a ReHo value for each vertex on the surface. C illustrates the steps to compute a fALFF map from rs-fMRI data. For each vertex, the power spectrum of its BOLD time course was computed, and fALLF resulted from the ratio of the low-frequency power to the power of the entire frequency range. D shows the basic principle of ICA of rs-fMRI data. Spatial-temporal activity maps acquired during a session at different timepoints (t) were decomposed by ICA into a set of spatially independent components (ICs), representing coherently activated resting-state networks.

