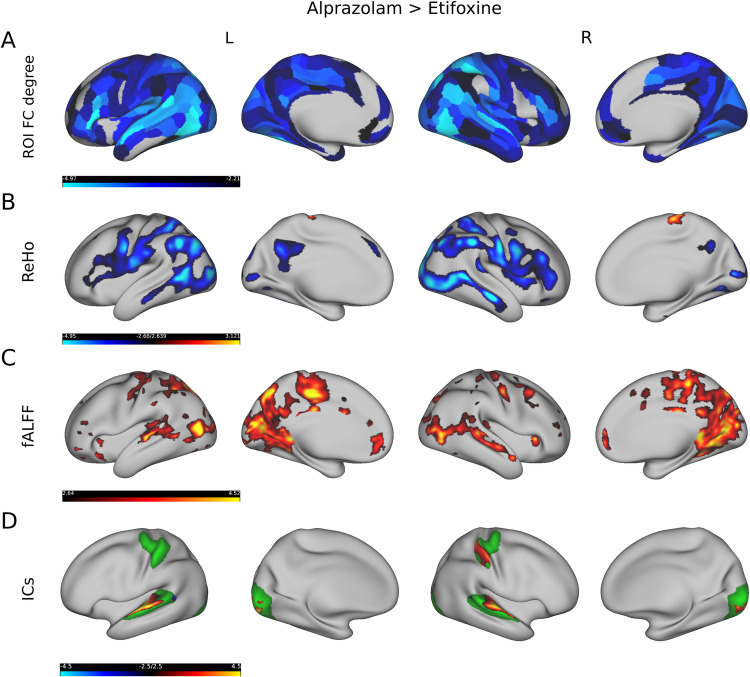
Fig. 5. Comparison of rs-fMRI measures between alprazolam and etifoxine.
The first row (A) shows that FC degree was significantly lower after administering alprazolam compared to etifoxine. The second row (B) depicts several regions in which local connectivity, as defined by ReHo, was lower after administering alprazolam compared to etifoxine. The third row (C) shows that low-frequency amplitudes, as derived from fALFF, were higher after administering alprazolam compared to etifoxine. The fourth row (D) illustrates alterations in ICA based resting-state networks, which show higher coherence in the alprazolam condition in the temporal, occipital and right somatosensory cortex. Yellow and blue colours depict t-values (from blue, alprazolam < etifoxine, to yellow, alprazolam > etifoxine).

