

Abstract
The existence of flaws seriously weakens the rock strength, directly affects the crack expansion morphology, and indirectly affects the slope stability. In this study, uniaxial compression tests were carried out on double-flawed granite to investigate the effects of flaw angle on its compressive strength and crack coalescence based on DIC technology and PFC2D numerical simulation. The result indicates that the UCS values of flawed specimens at angles of 15°, 30°, 45°, and 60° are approximately 25.5–51.7% lower than that of the intact specimen. The failure strength of the double-flawed sample increases with the increase of flaw inclination angle, and the fracture morphology shifts from no expansion to split expansion. When the flaw tip strain of each flaw sample exceeded 0.6%, the stress concentration was generated at the flaw tip, and the sample began to appear macroscopic large cracks. DIC technique can well observe the crack initiation and propagation process, recording inclined shear strain bands at flaw tips, tensile strain bands in the middle of flaws, and tensile shear O-shaped strain ring in rock bridge areas. Numerical simulations using PFC2D software were carried out and showed a good agreement with the physical results. In addition, the effect of structural inclination on specimen failure strength is clearly explained by the theory of compressive damage based on the projected size of flaws. The deformation of rock mass is not a simple material deformation but is composed of material deformation and structural deformation. These experimental and numerical results enhance our understanding of crack initiation and coalescence characteristics, aiding in the analysis of rock structure stability in scenarios such as excavated underground openings, slopes, and tunneling construction, where pre-existing cracks or step-path fractures are pivotal to structural integrity.
Keywords: Double flaws, Macrocracks, Fracture morphology, Digital image correlation, Particle flow code (PFC)
Subject terms: Civil engineering, Environmental sciences
Introduction
The stability of a rock slope greatly depends on the presence and properties of discontinuities (e.g., flaws, joints and caves) within the rock mass, and crack propagation and coalescence or the connection between other discontinuities may lead to the instability of a rock slope or serious geological hazards1,2. Therefore, for a rock slope, it is essential to know how the discontinuities behave and if they will connect with each other3.
Step-path failure is a typical instability mode of rock slopes with intermittent joints1, and among the numerous failure mechanisms, step-path failure may be the most important for evaluating high slopes4,5; however, it is difficult to investigate the process of step-path failure in situ, so this mechanism is generally investigated in laboratories by using rocks or rock-like materials. In the last few decades, researchers have applied theoretical, experimental, and numerical methods to studying the fracture initiation, propagation, and coalescence progress in rocks, and many studies have demonstrated that the number6, open type or filling type7, shape8, occurrence, and spatial relationships9 of preset fractures are the main factors affecting the failure characteristics of specimens. Shen10 noted that crack coalescence between two preexisting flaws (rock bridge region) can be caused by tensile failure, shear failure or mixed tensile-shear failure. Zhang and Wong11 conducted a uniaxial compression numerical simulation of a rock-like material with a single flaw and noted that the initiation of microcracks was almost entirely formed by a tensile crack, and the initiation of a microcrack band consisted of the tensile crack and the mixture of tensile and shear cracks. Cao et al.12 identified seven types of crack coalescence from the cracks in the specimens containing two flaws under uniaxial compression test. Zheng et al.13 pointed out that there are four forms of rock-bridge coalescence based on microcrack initiation, coalescence and failure evolution. According to the above test results, we can find that the crack coalescence between the flaws is likely to cause the occurrence of step-path failure.
In the macroscopic observation study of crack propagation and coalescence, the application of Digital Image Correlation (DIC) method provides visual characterization help for the rock fracture study. DIC method is an optical, non-contact, deformation measurement technique, which can calculate the displacement, deformation and strain spatial distribution of objects by measuring moire fringes and speckle interferometry, and is often used to accurately determine the crack location and crack propagation process of materials14–17. Yates et al.18 discussed the quantification of crack tip displacement fields using DIC, highlighting its applications in characterizing crack tip parameters such as stress intensity factors and crack tip opening angle. Mathieu et al.19 focused on identifying a crack propagation law through DIC. Gao et al.20 utilized DIC to investigate the rate dependence of fracture propagation in rocks, specifically studying the loading rate effect on a granitic rock. Nicola et al.21 presented an automated procedure for crack detection and measurement based on DIC, allowing for precise crack location detection and accurate crack kinematics measurement. Liu et al.22 pointed out that DIC observations of granite with a single flaw under uniaxial compression exhibit three types of initiation cracks: Mode I (opening mode), Mode II (sliding mode), and Mode I/II mixed cracks. Overall, DIC has proven to be a valuable tool in studying crack behavior in various materials and structures.
Numerical simulation has also been extensively applied in the study of rock crack propagation mechanisms and has achieved significant research results. Commonly, methods for studying fracture propagation in rock mass are: Finite Element Method (FEM), Distinct Element Method (DEM), Finite-Discrete Element Method (FDEM)23, Continuum Discontinuum Element Method (CDEM)24, Boundary Element Method (BEM), Grid Method, Poromechanics Model, Particle Method and Particle Flow Code in 2 Dimensions (PFC2D). In the extensive research above, the use of PFC2D in studying crack propagation behaviors in various materials has been a prevalent research topic in recent years. Lee et al.25 investigated crack coalescence in pre-cracked specimens under uniaxial compression, classifying it based on previous works on parallel flaws. Wang et al.26 combined PFC2D with a joint network generation method to examine the mechanical behaviors of jointed rock masses, focusing on crack propagation during compression tests. Similarly, Yang et al.27 utilized PFC2D to model Brazilian disc splitting tests, analyzing displacement trends during crack initiation and propagation to understand meso-mechanical mechanisms. Zhou et al.28 studied the fracturing behavior of concrete specimens containing microcapsules and microcracks using PFC2D, highlighting the influence of crack inclination angle and ligament length on crack coalescence. Furthermore, Yin et al.29 employed PFC2D in discrete element modeling to simulate the mechanical behavior of transversely isotropic rock under uniaxial compression, emphasizing the impact of micro-crack distribution on failure behavior. Lastly, Yuan et al.30 conducted an experimental study on prefabricated single-cracked red sandstone under uniaxial compression using PFC2D to analyze the mechanical properties and failure mode influenced by crack dip angle. Overall, the literature review demonstrates the wide application of PFC2D in studying crack behavior in various materials, providing valuable insights into crack initiation, propagation, and coalescence mechanisms under different loading conditions and material compositions.
Overall, above studies offer valuable insights into the failure behavior of rock samples with flaws, highlighting the impact of loading rate, filling, number of fractures, and combined loading conditions on rock mechanical properties and failure characteristics. However, under the influence of double flaws, studies about observation and evolution process of sample stress distribution, crack initiation and coalescence behavior were rarely mentioned or investigated. Therefore, DIC observation and PFC2D numerical simulation were used to investigate the crack propagation and coalescence evolution process, which is of great significance for in-depth understanding of step-path failure mechanism, assessment of rock stability and bearing capacity, and improvement of rock slope safety and protection.
Experimental methods and progress
Material and sample
The experimental rock is granite, which was collected from the Beizhan iron mine in Tianshan area, Xinjiang, China. The mining area is located in the north foot of Tianshan Mountain, which is surrounded by Quaternary permanent glaciers. This area belongs to continental temperate semi-arid climate, and also belongs to the cold climate area with alpine snow all the year round. The climate is characterized by a long winter and a cold weather. Rain and snow are frequent throughout the year. The rainy season is from July to August, with rain and snow almost every day; snow and ice begin to melt in April, and snow begins to accumulate in October, with an annual rainfall of 400–500 mm. The mine is characterized by steep terrain, large slope, fragmentation rock, developed multi-joints, small-scale faults, and lack of vegetation, and there are many discontinuous flaws and rock bridge structures on the slope, which forming step-path destructive slope, as shown in Fig. 1.
Fig. 1.

Step-path slope with discontinuous flaws and rock bridge structures: (a) slope with intermittent joints and (b) conceptual diagram of non-parallel joints, adapted from Huang1.
Tested rock is taken from the granite material, after cutting and grinding, it is processed into a standard cylinder specimen of ϕ50 mm × 100 mm, which has a pair of non-parallel flaws cut by using a high-pressure water-jet in the middle of the specimen, as shown in Fig. 2. According to Huang's conceptual diagram of non-parallel joints1, the flaw dip angles are set as 15°, 30°, 45° and 60°, respectively. The flaw length is 15 mm and the rock bridge length between flaws is 18 mm. After specimen preparation, the uniaxial compression test can be carried out. The granite has a semi-automorphic-automorphic granular structure, and the porphyritic structure is obvious. The mineral particle size is about 0.3–2.0 mm. The main minerals are striated feldspar (60–65%), quartz (20–25%), a small amount of micro plagioclase, hornblende, biotite, etc., and the secondary minerals are magnetite, sphene, apatite, etc.
Fig. 2.

Uniaxial compression test procedure and DIC test system.
Testing equipment
The test machine is the CMT5505 electromechanical testing system produced by MTS Company, with force capacities from 5 to 600 kN, with displacement resolution of 0.015 μm, as illustrated in Fig. 2. This system can accurately measure the load, deformation, and displacement. The deformation speed control during the loading process is sensitive, and the loading accuracy is reliable. In this test, the axial loading velocity was set as 0.06 mm/min to ensure the sample was in quasi-static condition.
The strain deformation of specimens was measured by the DIC-3D test system. This non-contact full-field deformation measurement system mainly includes high-speed camera with resolution of 2048 × 2048 pixels, LED lights, trigger acquisition, DIC-3D numerical image processing software, etc. DIC technology principle: By spraying speckles on the specimen surface or using the natural texture of the object surface, using a camera to collect the deformed pictures before and after the experiment, with the help of post-processing programs to find the corresponding speckle position on the object surface before and after the deformation through the gray-level recognition matching algorithm. Solve to get the displacement vector of the pixel, and then get the full-field displacement and strain information of the specimen surface31. In addition, the sample rate of camera was set as 30 frames per second to capture the deformational images of sample surface for following DIC analysis.
Experimental results
Stress–strain curves
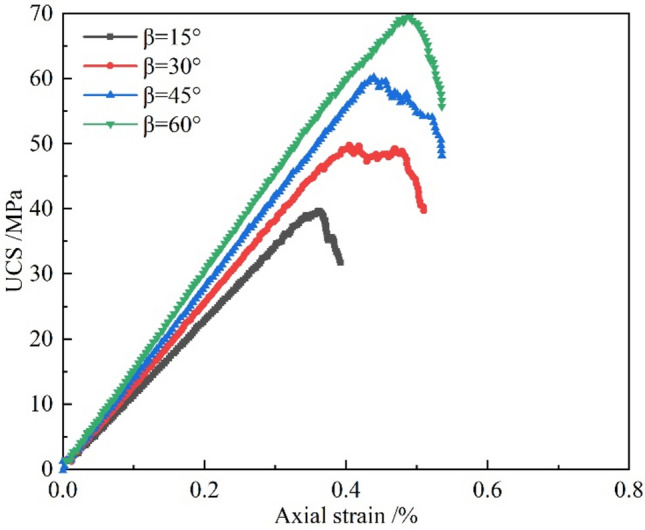
Figure 3a shows the stress–strain curves of the intact specimen and flawed specimens with different dip angles. Observation shows that the existence of flaws seriously weakens the rock strength. The curves of each specimen were long at the elastic stage, short at the compaction stage and yield stage, and short at the post-peak stage. Once exceeding the peak strength, the curves showed a rapid downward trend, showing an obvious brittle failure. The elastic modulus of rock can be obtained from the slope of elastic stage of the stress–strain curve, i.e. the ratio of stress (σ) to strain (ε) in unit linear length. Figure 3b shows the comparison of mechanical parameters of specimens. From the figure, the uniaxial compressive strength of each flawed specimen is obviously less than that of the intact specimen, and its UCS value is about 25.5–51.7% of the intact specimen. At the same time, as the dip angle β increases, the uniaxial compressive strength and elastic modulus of the flawed specimen show a monotonous increasing trend. When the flaw angle β is 15°, the sample exhibits the smallest values of UCS and E, along with a highest axial peak strain, which indicates that the flaw is easy to be compressed and closed at the rock bridge region, resulting in a weaker supporting effect under axial pressure and leads to a closed failure. Conversely, when the flaw angle β is 60°, the sample shows the largest values of UCS and E, while having a smallest peak axial strain. This is because the vertical structure of the flaw has a strong supporting effect under axial pressure, and finally the sample has a strong strength and results in splitting expansion failure. Failure parameters of samples are summarized in Table 1.
Fig. 3.

Stress–strain curves and the destruction parameters comparison about rock samples. (a) Stress-strain curves (b) comparison of UCS and E value.
Table 1.
Failure parameters of different granite samples under compression.
| Sample type | Flaw length 2a (mm) | Rock bridge length lb (mm) | Peak axial strain εap (%) | UCS (MPa) | E (GPa) |
|---|---|---|---|---|---|
| No flaws | – | – | 0.39 | 143.3 | 44.2 |
| β = 15° | 15 | 18 | 0.38 | 36.5 | 11.1 |
| β = 30° | 15 | 18 | 0.39 | 46.0 | 12.8 |
| β = 45° | 15 | 18 | 0.39 | 60.2 | 16.6 |
| β = 60° | 15 | 18 | 0.41 | 74.1 | 21.9 |
Macroscopic fracture and DIC strain field evolution
Macroscopic cracks are formed by the initiation, propagation and coalescence of microcracks. As such, the formation of macroscopic cracks is not an abrupt behavior, but a cumulative damage process. In previous studies, many scholars have used high-resolution digital cameras and digital image correlation techniques to record detailed geometric representations of crack evolution32,33. These high-resolution images can identify the initiation sequence and crack patterns of these macroscopic cracks. DIC technology can clearly analyze the displacement field and strain field when cracks occur, and can both conduct qualitative and quantitative analysis of the cracking process.
A detailed investigation for crack evolution of double-flawed granite with different inclination angles was carried out, as depicted in Fig. 4, which illustrates the maximum principal strain of new crack formation under axial stress and the corresponding fracture morphology diagram during uniaxial compression testing. In this study, the maximum principal strain34 calculated through digital image correlation is utilized to detect rock damage and failure, as early as possible enabling the identification of such occurrences compared to other strain variables. Macrocracks, visible to the naked eye, were detected at the flaw tip through locally magnified high-resolution images. For the brittle granite in this paper, the macroscopic crack is determined when the maximum principal strain reaches approximately 0.6%, and the stress is defined as the macrocrack occurrence stress.
Fig. 4.


Evolution of fractures on rock surfaces and DIC strain field nephograms. (a) β=15° (b) β=30° (c) β=45° (d) β=60°.
The influence of inclination angle on crack evolution and crack patterns can be clearly observed through DIC strain field. Throughout the fracture process of the rock, the sample is in the state of compression and compaction for a large period of time, and the crack penetration occurs only a few seconds before the overall failure. For the 15° sample, at 21.74 MPa (59.6%UCS); For the 30° samples, at 29.85 MPa (64.9%UCS); For the 45° samples, at 42.76 MPa (71.0%UCS); For the 60° sample, at 44.59 MPa (60.2%UCS), the sample began to show tip cracking caused by concentrated stress at the edge of flaw. Subsequently, tensile cracks appear on the rock surface and local shedding and slagging occur. Finally, within a very short timeframe, sudden failure occurred as large cracks propagated, resulting in rock debris splashing and a loud noise, indicative of a brittle failure of the granite rock.
Taking β = 30° sample as a case study, combined with the full stress–strain curve, the fracture morphology and DIC strain field evolutionary nephogram of the granite during compression were analyzed, as shown in Fig. 5. The compression deformation process can be divided into four stages35, which are: the crack compaction stage, the linear elastic stage or crack stable development stage, the plastic yield stage, and the residual bearing stage.
Crack compaction stage (OA), the pores or micro-cracks in the specimen are gradually closed, the rock is compacted, forming an early nonlinear deformation, the stress–strain curve is concave upward, and the DIC cloud image shows a scattered pattern;
Linear elastic stage (AB), The rock is continuously compressed, with stable crack development and propagation, and its stress–strain curve approaches a straight line. The DIC strain cloud nephogram shows: Red color is displayed at the pre-existing flaw position, indicating that large strain caused by stress concentration is generated. And a slight color change occurs on the rock bridge's penetrating path, which forms an early O-shaped pattern between the pre-existing flaws and the rock bridge region;
Plastic yield stage (BC), the rock transforms from the elastic state to the plastic state, resulting in an obvious irreversible deformation. The pre-existing flaws are continuously closed, and numerous new cracks appear, causing macroscopic tension cracks at the rock bridge region. The DIC cloud image shows that the strain field at the pre-existing flaws is more concentrated, the strain value is further increased, and the O-shaped pattern is more apparent;
Residual bearing stage (CD), the residual curve is short, and a large number of destructive cracks appear inside the rock, causing a continuous decrease in bearing capacity. The DIC cloud images illustrate that the fracture penetrates quickly in a short period of time. Due to the large deformation or the partial fall-off on the sample surface, some speckle coordinate information is missing, resulting in the DIC calculation failure, and the DIC loss area continues to expand. Finally, the convergence of pre-existing flaws and the rock bridge region results in the O-shaped fracture formation, and the extension line at the tip of flaw forms a large crack.
Fig. 5.

Stress–strain evolution process of the double-flaw sample (β = 30°).
Crack propagation and patterns
For sample with two non-parallel flaws, many different types of cracks could be observed under uniaxial compression, and most of these cracks appear as irregular bending cracks. Various terminologies have been used to describe crack patterns observed in experiments or numerical studies to characterize and classify cracks emanating from a pre-existing flaw. Scholars usually identify wing cracks and anti-wing cracks based on the morphology of the crack propagation path12,36, and usually consider the primary crack as a tension wing crack37–39 and the secondary crack as a shear crack or a mixed tensile and shear crack. Following, we will evaluate the crack trajectory development from the flaw tip, middle position of flaw and rock bridge regions in Fig. 6.
The crack trajectory development at the flaw tip: The crack initiation often starts from the flaw tip, where stress concentration is prone to occur at the flaw end. When the sample reaches its yield limit, tensile stress is released at the flaw tip, leading to the development of an initiation crack perpendicular to the direction of the tensile stress. As the initiation crack continues to propagate, it can easily evolve into a tensile or tensile shear fracture at the far field end of the flaw. Approaching the point of failure, a single bevel shear failure or X-conjugate bevel shear failure may occur, with the fracture plane angle closely aligning with the prediction of the Coulomb Failure Criterion, where θc = 45° + φ/2 and φ represents the internal friction angle of the specimen. In this study, the internal friction angle φ is measured at 36°, resulting in θc = 63°, which is basically consistent with the experimental result of the 45°inclination angle sample and corroborates published literature40.
The crack trajectory development nearby the middle of flaw: It has been observed that tensile T-cracks tend to form in the middle of flaw. This phenomenon occurs due to the fact that the vertical pressure is easy to bend the flaw structure, causing bending moment and generating tensile stress, which promotes the flaw surfaces to be close to each other. Once the tensile stress surpasses the ultimate tensile strength of the granite rock, the flaws undergo flexural tensile failure. The failure occurring nearby the middle of flaw aligns with the published findings41, and the new crack initiation process in the middle of flaw is shown in Fig. 7. However, due to the influence of rock heterogeneity and flaw inclination, such failure in the middle of flaw is not very obvious.
The crack trajectory development at the rock bridge regions: In the rock bridge region between double flaws, the propagation path also initiates from the flaw tip, leading to the gradual appearance of T-type micro-cracks. As the compressive stress intensifies, the opening extent of the T-type crack progressively grows, leading to tensile splitting and the formation of macro-shear strain bands. Ultimately, the split crack links the pre-existing flaws, culminating in the creation of an O-shaped strain circle encircling the rock bridge region.
Fig. 6.

Crack initiation and coalescence process of granite specimen containing different flaw inclination angles. (a) β=15° (b) β=30° (c) β=45° (d) β=60°.
Fig. 7.

Schematic diagram of relative deformation and new crack initiation on the flaw surface.
Change of flaw width
As discussed in the previous section, it is evident that during uniaxial compression, the inner surface of the flaw will undergo gradual relative deformation, potentially resulting in an increase or decrease in the flaw width. To facilitate this analysis, we can identify and designate the midpoint of the flaw in the post-processing phase of DIC as marker points, denoted as A, A', B, and B', to accurately document the relative deformation between these marker points. The schematic representation of the marker points’ positions is illustrated in Fig. 7e.
Figure 8 illustrates the time-dependent variation curves of the flaw widths dA-A' and dB-B'. During the loading process, the initial flaw widths were all 1 mm, and the flaw widths of the other samples were gradually narrowed with the increase of time, except for the increase of the flaw widths of the samples β = 30°. At the point of failure, the flaw widths for the β = 15° samples were dA-A' = 0.92 mm and dB-B' = 0.98 mm. For the β = 30° samples, the upper flaw width was dA-A' = 0.96 mm and the lower flaw width was dB-B' = 1.02 mm. The flaw widths for the β = 45° samples were dA-A' = 0.93 mm and dB-B' = 0.96 mm, while for the β = 60° samples, they were dA-A' = 0.99 mm and dB-B' = 0.95 mm. This observation indicates that the gradual closure of these prefabricated flaws directly triggers the formation of tensile T-cracks in the middle of the flaw.
Fig. 8.

Variation curves of the flaw width dA-A', dB-B' with time. (a)β=15° (b)β=30° (c)β=45° (d) β=60°.
Numerical simulation
Numerical model construction and micro-parameter calibration
The PFC2D numerical simulation is an essential tool for investigating the mechanical properties and damage modes of fractured rocks and discontinuous media42. Utilizing the Linear Parallel Bond Model in PFC2D, a numerical specimen model with two conjugate flaws is established.
To ensure the consistency between the numerical model and the experimental results, the model geometric size reaches the test size of the laboratory sample. The model geometry in PFC2D is constructed as 50 mm × 100 mm, with a particle density of 2700 kg/m3, and 12,878 particles. Due to the large difference between micro-parameters in PFC2D and macroscopic parameters of macroscopic mechanical behavior, reasonable micro-parameters are generally calibrated by the "trial and error method"11, that is, by constantly adjusting micro-parameters, the numerical results can be better matched with the Laboratory results. Through the calibration of micro-parameters, we obtained a group of micro-parameters as shown in Table 2. Among the micro-parameters, the maximum radius (Rmax) and minimum radius (Rmin) are set as 0.83 and 0.5 respectively, and the particle size ratio (Rmax/Rmin) is 1.66, which is within a reasonable range. This particle size configuration ensures a uniform distribution of particles within the test specimen, meeting the minimum particle number requirement and maintaining a stable axial stress throughout the simulation.
Table 2.
Model micro-parameters in PFC2D.
| Model | Micro-parameters (unit) | Value |
|---|---|---|
| Parallel-bond Model | Minimum radius, Rmin/mm | 0.25 |
| Maximum radius, Rmax/mm | 0.415 | |
| Effective modulus of the particle, Ec/GPa | 4.8 | |
| Ratio of normal to shear stiffness of the particle, kn/ks | 1.5 | |
| Particle friction coefficient, μ | 0.1 | |
| Installation gap g0/mm | 0.05 | |
| Parallel-bond radius multiplier, λ | 1.0 | |
| Effective modulus of the parallel-bond, c/GPa | 4.8 | |
| Ratio of normal to shear stiffness of the parallel-bond, n/ s | 1.5 | |
| Parallel-bond tensile strength, σt/MPa | 34.5 ± 6.5 | |
| Parallel-bond cohesion /MPa | 38.5 ± 6.5 | |
| Parallel-bond friction angle /° | 0 |
After constructing the PFC2D model, it is essential to incorporate two conjugate cracks into the model and simulate their behavior under compression conditions. Various methods can be used to simulate cracks, such as reducing the adhesion parameters of particles around the cracks, using smooth nodal models, or deleting particle balls at specific locations. In this study, we opted to simulate non-closed cracks by deleting particle balls at specific locations. The flaw length is fixed at 15 mm, with the shortest rock bridge length between the two flaws at 18 mm. The inclination angles of the conjugate flaws are defined as 15°, 30°, 45°, and 60° respectively.
Comparison of stress–strain curves
The stress–strain curves of models with different inclination angles under the uniaxial compression test are shown in Fig. 9. In the fracture specimens, the peak strength gradually increases when the inclination angle β increases within the range of 15–60°, the peak compressive strengths of numerical simulation are determined as σ15° = 39.5 MPa, σ30° = 49.7 MPa, σ45° = 57.3 MPa, σ60° = 69.5 MPa, respectively, which the differences from the physical test values are 7.6%, 7.4%, 5.1%, and 6.6%, respectively. It is evident that the simulated peak strengths closely match the experimental peak strengths, and the stress–strain curves exhibit similar trends. These results not only validate the feasibility of the numerical model but also confirm the accuracy of the micro-parameters employed.
Fig. 9.
Stress–strain curves of numerical simulation under compression.
Evolution of crack growth
Figure 10 shows the microcrack evolution process of double-flawed rocks with different dip angles. The red irregular line in the figure represents tensile fracture, with the final tensile fracture numbers of rock samples being 2 640, 2 487, 2 417, 2 304, and 3 188, respectively. The green zone indicates the stress concentration area at the flaw tip, which can produce tensile-shear composite failure. With the loading steps increase, the area of tensile-shear composite failure gradually expands. Analyzing the entire fracture processes of samples with different dip angles reveals that the stress concentration initially occurs at the end of flaws, leading to the formation of a tensile wing crack near the flaw end that extends outward at a specific angle around the flaw. As the wing crack and coplanar secondary crack propagate, tensile shear fracture occurs in the rock bridge region. As cracks expand significantly, the rock bridge gradually breaks through and forms a macroscopic fracture surface, ultimately causing model instability and failure. The PFC2D simulated damage results and crack extension show similarities with the experimental results.
Fig. 10.

Crack growth evolution of double-flaw specimen in numerical simulation. (a) β=15° (b) β=30° (c) β=45° (d) β=60°.
By comparing the macrocrack growth process of the physical experiment in Fig. 4 and the tensile fracture growth process of the numerical simulation in Fig. 10, we find that macrocracks approximately occur at higher stress levels in physical tests, the corresponding stress levels are 59.6%, 64.9%, 71.0%, and 60.2%, respectively. The tensile fractures of each numerical sample are produced at the stress levels of 50%, 50%, 50%, and 50% respectively. The comparison results are shown in Table 3. This outcome is as expected since the granites used were brittle rocks. Brittle materials are not prone to axial deformation, so the macrocrack occurrence stress in physical results is higher. At the same time, comparing the stress–strain curves of the physical and numerical results, we find that the peak stress at the same inclination angle is very close, and so is the peak axial strain. These results validate the numerical model's feasibility and confirm the accuracy of the micro-parameters used in PFC.
Table 3.
Strength and strain of different samples of physical test and numerical study.
| Sample type | Physical test | PFC2D simulation | ||||
|---|---|---|---|---|---|---|
| Macrocrack occurrence stress (MPa) | Peak stress (MPa) | Peak axial strain εap (%) | Macrocrack occurrence stress (MPa) | Peak stress (MPa) | Peak axial strain εap (%) | |
| β = 15° | 21.74(59.6%) | 36.5 | 0.38 | 19.75(50%) | 39.5 | 0.36 |
| β = 30° | 29.85(64.9%) | 46.0 | 0.39 | 24.85(50%) | 49.7 | 0.40 |
| β = 45° | 42.76(71.0%) | 60.2 | 0.39 | 30.10(50%) | 57.3 | 0.42 |
| β = 60° | 44.59(60.2%) | 74.1 | 0.41 | 34.75(50%) | 69.5 | 0.49 |
Discussion
Observing the cracking mode and failure morphology of the specimen with flaws. Figure 11 lists the simplified cracking mode of the specimen under axial compression. The crack extension modes can be classified into three types: wing crack, coplanar secondary crack and oblique secondary crack43. PFC2D numerical simulation results can generally observe the generation of these three types of cracks. Wing cracks are typically observed at or near the two flaw tips and appear to grow gradually nearby the two wing-shaped regions. Coplanar secondary cracks originate at the flaw tip and propagate along the initial direction of the primary flaw. On the other hand, oblique secondary cracks initiate from the flaw tip at an arbitrary angle in the opposite direction of the wing cracks.
Fig. 11.
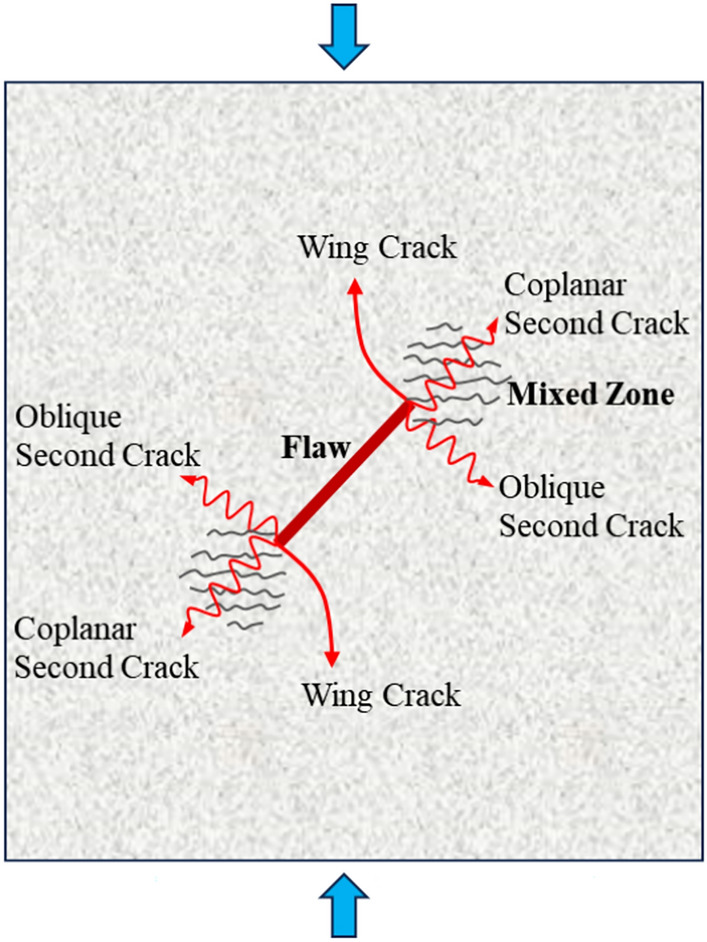
Simplified cracking pattern of the cracked specimens in axial compression experiments.
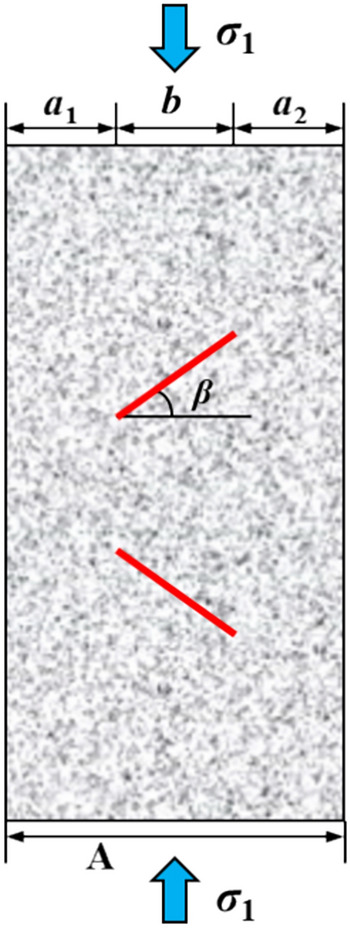
The flaw dip angle has an obvious impact on the peak strength of the specimen. Both experimental and numerical results indicate that the larger the flaw dip angle, the higher the compressive strength of the specimen. This changing trend in strength can be explained by damage theory. In fracture mechanics, the crack initiation strength can be judged by the Griffith failure criterion, but the crack initiation cannot indicate sample failure, so it is inappropriate to describe the rock mass failure strength using the Griffith failure criterion. For the compressive strength of specimens with preexisting flaws, currently, damage theory is mostly used to deal with this issue44, and the theoretical expression is shown in Eq. 1. The mechanical model of the specimen with preexisting flaws is shown in Fig. 12.
| 1 |
Fig. 12.
The mechanical model of rock mass with preexisting flaws.
In the formula, symbol A is the total area of rock mass subjected to axial stress σ1; σ1b is the strength of intact rock (σ1b = σc); σ1j is the strength of the fractured rock; a is the area of intact rock that generates resistance force; b is the area of the fractured rock that generates resistance force.
For the uniaxial compression test of rock with preexisting flaws, without confining pressure σ3, the intact rock strength of σ1b is a certain value. Moreover, because the fracture length and total area are constant values and the strength σ1j is less than the strength σ1b, then the length a gradually increases while the length b gradually decreases with the increase of the flaw dip β. This relationship can be expressed as σ1-15° < σ1-30° < σ1-45° < σ1-60° according to formula (1). Overall, the theoretical analytical solution for rocks with preexisting flaws aligns with both numerical solutions and experimental results. When β is small, the specimen fails at a lower strength, whereas when β is large, the specimen fails at a higher strength.
Notably, the numerical simulation results show that the UCS values, cracking pattern, and cracking processes that occur in specimens are the same as lab experimental results. Due to the existence of flaws and structural surfaces, the deformation of rock mass is not a simple material deformation but is composed of material deformation and structural deformation. For fractured rock mass, the deformation and strength parameters show anisotropy with the change of structural plane inclination. Before the formation of the macroscopic fracture plane of the rock, the microcracks do not penetrate straight along the direction of the original fracture plane but produce wing-like fracture. When the crack density is large enough, the tensile cracks and shear cracks increase and merge gradually until the coalescence is formed in the rock bridge region. The continuous coalescence of these controlling discontinuities is a key controlling factor for the gradual penetration of rock bridge regions, and even for the collapse and sliding disasters of rock slopes.
Conclusions
In this investigation, we conducted a series of compression experimental observations on double-flaw granite specimens, recorded the crack fracture evolution process based on DIC method, and verified the success of crack cracking with PFC2D numerical simulation, and got the following conclusions.
Rock flaw structure seriously affects the rock strength and fracture pattern. The granite shows obvious brittle failure under uniaxial compression. The UCS values of flawed specimens at angles of 15°, 30°, 45°, and 60° are approximately 25.5–51.7% lower than that of the intact specimen. As the flaw angle β increases, both the UCS and E values show a gradual increase, and the fracture morphology shifts from no expansion to split expansion. Additionally, when the flaw tip strain of each flaw sample exceeded 0.6%, the stress concentration was generated at the flaw tip, and the sample began to appear macroscopic large cracks.
The DIC method proved to be an effective tool for capturing the crack initiation and coalesce process at the end, middle and rock bridge area of flaws. At the flaw tip, either a single bevel shear failure or an X-conjugate bevel shear failure occurs along the flaw direction. Nearby the middle of the flaw, a tensile T-crack forms, and in the rock bridge region an O-type strain ring appears.
The PFC2D effectively confirmed the crack propagation observed in the physical results, reflecting the microfracture evolution process of rock samples. Stress concentration initially occurs at the flaw end, leading to the formation of a tensile wing crack. Tensile shear fracture then takes place in the rock bridge area, eventually converging into a macroscopic fracture.
By utilizing a mechanical model of the flaw specimen, the theoretical explanation for the impact of flaw angle on the peak strength of the sample is provided. The flaw structural angle seriously controls the rock mass failure. The deformation of rock is not a simple material deformation, but is composed of material deformation and structural deformation.
Acknowledgements
The research was supported by the National Natural Science Foundation of China (52174109), the Science and Technology Project of Henan Province (232102320328, 242102320373), the Program for Key Scientific Research of Universities in Henan Province, China (24A440004, 24A440005), the Fundamental Research Funds for the Universities of Henan Province (NSFRF230610), and the China Postdoctoral Science Foundation (2022M721034).
Author contributions
Z.Q.H. Conceptualization, Data curation, Methodology, Writing-Original Draft. R.F.Y. Project administration, Supervision, Funding acquisition. Y.C. Software, Resources, Validation. W.S. Visualization, Writing-Reviewing and Editing. All authors reviewed the manuscript. All authors of this article consent to publish.
Data availability
The datasets generated and/or analysed during the current study are available in the figshare repository, https://figshare.com/s/6007babb929cf02ee1b4.
Competing interests
The authors declare no competing interests.
Footnotes
Publisher's note
Springer Nature remains neutral with regard to jurisdictional claims in published maps and institutional affiliations.
References
- 1.Huang, D., Cen, D., Ma, G. & Huang, R. Q. Step-path failure of rock slopes with intermittent joints. Landslides12, 911–926 (2015). 10.1007/s10346-014-0517-6 [DOI] [Google Scholar]
- 2.Camones, L. A. M., Vargas, E. D., Figueiredo, R. P. & Velloso, R. Q. Application of the discrete element method for modeling of rock crack propagation and coalescence in the step-path failure mechanism. Eng. Geol.153(2), 80–94 (2013). 10.1016/j.enggeo.2012.11.013 [DOI] [Google Scholar]
- 3.Sun, L., Grasselli, G., Liu, Q. S., Tang, X. H. & Abdelaziz, A. The role of discontinuities in rock slope stability: Insights from a combined finite-discrete element simulation. Comput. Geotech.147, 104788 (2022). 10.1016/j.compgeo.2022.104788 [DOI] [Google Scholar]
- 4.Zhou, X. P. & Chen, J. W. Extended finite element simulation of step-path brittle failure in rock slopes with non-persistent en-echelon joints. Eng. Geol.250, 65–88 (2019). 10.1016/j.enggeo.2019.01.012 [DOI] [Google Scholar]
- 5.Xu, J., Fan, Y. F., Xiao, X. C., Jin, J. X. & Li, X. Experimental and numerical study of step-path failure in jointed rocks. Theor. Appl. Fract. Mech.126, 103981 (2023). 10.1016/j.tafmec.2023.103981 [DOI] [Google Scholar]
- 6.Huang, H. S. Influence of crack location and crack number on the responses of 3D representative unit cell of unidirectional composites under tension in the fiber direction. J. Compos. Mater.56(20), 3143–3157 (2022). 10.1177/00219983221109947 [DOI] [Google Scholar]
- 7.Yin, F. T. et al. Mechanical behaviors and failure mechanism of flawed sandstone containing infillings under freeze-thaw cycles and uniaxial compression. Theor. Appl. Fract. Mech.126, 103979 (2023). 10.1016/j.tafmec.2023.103979 [DOI] [Google Scholar]
- 8.Fan, X. et al. Internal stress distribution and cracking around flaws and openings of rock block under uniaxial compression: A particle mechanics approach. Comput. Geotech.102, 28–38 (2018). 10.1016/j.compgeo.2018.06.002 [DOI] [Google Scholar]
- 9.Zhao, Y. S., Gao, Y. T., Wu, S. C., Chen, L. & Zhang, C. L. Experimental and numerical study of failure characteristics of brittle rocks with single internal 3D open-type flaw. Acta. Geotech.16, 3087–3113 (2021). 10.1007/s11440-021-01285-8 [DOI] [Google Scholar]
- 10.Shen, B. The mechanism of fracture coalescence in compression—experimental study and numerical simulation. Eng. Fract. Mech.51(1), 73–85 (1995). 10.1016/0013-7944(94)00201-R [DOI] [Google Scholar]
- 11.Zhang, X. P. & Wong, L. N. Y. Cracking processes in rock-like material containing a single flaw under uniaxial compression: A numerical study based on parallel bonded-particle model approach. Rock Mech. Rock Eng.45(5), 711–737 (2012). [Google Scholar]
- 12.Cao, P., Liu, T. Y., Pu, C. Z. & Lin, H. Crack propagation and coalescence of brittle rock-like specimens with pre-existing cracks in compression. Eng. Geol.187, 113–121 (2015). 10.1016/j.enggeo.2014.12.010 [DOI] [Google Scholar]
- 13.Zheng, L. F., Huang, D., Li, X. Q. & Hu, X. Numerical analysis of fracture behaviour on marble samples containing two flaws. Adv. Civ. Eng.1, 1–15 (2020). [Google Scholar]
- 14.Cinar, A. F. et al. An autonomous surface discontinuity detection and quantification method by digital image correlation and phase congruency. Opt. Lasers Eng.96, 94–106 (2017). 10.1016/j.optlaseng.2017.04.010 [DOI] [Google Scholar]
- 15.Sharafisafa, M., Aliabadian, Z. & Shen, L. M. Crack initiation and failure of block-in-matrix rocks under Brazilian test using digital image correlation. Theor. Appl. Fract. Mech.109, 102743 (2020). 10.1016/j.tafmec.2020.102743 [DOI] [Google Scholar]
- 16.Jia, M. D., Wu, Z. M., Yu, R. C. & Zhang, X. X. Experimental and numerical study on mixed mode I-II fatigue crack propagation in concrete. J. Eng. Mech.148(9), 04022044 (2022). 10.1061/(ASCE)EM.1943-7889.0002135 [DOI] [Google Scholar]
- 17.Xue, F., Lin, Z. Q. & Wang, T. Z. Experimental study on cracking process and fracture properties of granite under mode I loading by acoustic emission and digital image correlation. Fatigue Fract. Eng. Mater. Struct.46(5), 1921–1936 (2023). 10.1111/ffe.13973 [DOI] [Google Scholar]
- 18.Yates, J. R., Zanganeh, M. & Tai, Y. H. Quantifying crack tip displacement fields with DIC. Eng. Fract. Mech.77(11), 2063–2076 (2010). 10.1016/j.engfracmech.2010.03.025 [DOI] [Google Scholar]
- 19.Mathieu, F., Hild, F. & Roux, S. Identification of a crack propagation law by digital image correlation. Int. J. Fatigue.36(1), 146–154 (2012). 10.1016/j.ijfatigue.2011.08.004 [DOI] [Google Scholar]
- 20.Gao, G., Yao, W., Xia, K. & Li, Z. Investigation of the rate dependence of fracture propagation in rocks using digital image correlation (DIC) method. Eng. Fract. Mech.138, 146–155 (2015). 10.1016/j.engfracmech.2015.02.021 [DOI] [Google Scholar]
- 21.Nicola, G., Jaime, M. F. & Walter, K. Automated crack detection and measurement based on digital image correlation. Constr. Build. Mater.256, 119383 (2020). 10.1016/j.conbuildmat.2020.119383 [DOI] [Google Scholar]
- 22.Liu, L. W., Li, H. B., Li, X. F., Wu, D. & Zhang, G. K. Underlying mechanisms of crack initiation for granitic rocks containing a single pre-existing flaw: Insights from digital image correlation (DIC) analysis. Rock Mech. Rock Eng.54(2), 857–873 (2021). 10.1007/s00603-020-02286-x [DOI] [Google Scholar]
- 23.Wu, D., Li, H. B., Fukuda, D. & Liu, H. Y. Development of a finite-discrete element method with finite-strain elasto-plasticity and cohesive zone models for simulating the dynamic fracture of rocks. Comput. Geotech.156, 105271 (2023). 10.1016/j.compgeo.2023.105271 [DOI] [Google Scholar]
- 24.Wu, D. et al. Effects of infilling materials on mechanical behaviors and cracking process of pre-cracked rock: Insights from a hybrid continuum-discontinuum method. Eng. Fract. Mech.253, 107843 (2021). 10.1016/j.engfracmech.2021.107843 [DOI] [Google Scholar]
- 25.Lee, H. & Jeon, S. An experimental and numerical study of fracture coalescence in pre-cracked specimens under uniaxial compression. Int. J. Solids. Struct.48(6), 979–999 (2011). 10.1016/j.ijsolstr.2010.12.001 [DOI] [Google Scholar]
- 26.Wang, P. T., Yang, T. H., Yu, Q. L., Liu, H. L. & Zhang, P. H. Characterization on jointed rock masses based on PFC2D. Front. Struct. Civ. Eng.7, 32–38 (2013). 10.1007/s11709-013-0187-9 [DOI] [Google Scholar]
- 27.Yang, S. Q. & Huang, Y. H. Particle flow study on strength and meso-mechanism of Brazilian splitting test for jointed rock mass. Acta. Mech. Sinica-Prc.30(4), 547–558 (2014). 10.1007/s10409-014-0076-z [DOI] [Google Scholar]
- 28.Zhou, S., Zhu, H. H., Yan, Z. G., Ju, J. & Zhang, L. Y. A micromechanical study of the breakage mechanism of microcapsules in concrete using PFC2D. Constr. Build. Mater.115, 452–463 (2016). 10.1016/j.conbuildmat.2016.04.067 [DOI] [Google Scholar]
- 29.Yin, P. F. & Yang, S. Q. Discrete element modeling of strength and failure behavior of transversely isotropic rock under uniaxial compression. J. Geol. Soc. India.93, 235–246 (2019). 10.1007/s12594-019-1158-0 [DOI] [Google Scholar]
- 30.Yuan, Y., Fu, J. L., Wang, X. L. & Shang, X. Experimental study on mechanical properties of prefabricated single-cracked red sandstone under uniaxial compression. Adv. Civ. Eng.2020, 1–14 (2020). [Google Scholar]
- 31.Tang, Z. Z., Liang, J., Xiao, Z. Z., Guo, C. & Hu, H. Three-dimensional digital image correlation system for deformation measurement in experimental mechanics. Opt. Eng.49(10), 103601 (2010). 10.1117/1.3491204 [DOI] [Google Scholar]
- 32.Zhao, C., Xing, J. Q., Zhou, Y. M., Shi, Z. M. & Wang, G. Experimental investigation on hydraulic fracturing of granite specimens with double flaws based on DIC. Eng. Geol.267, 105510 (2020). 10.1016/j.enggeo.2020.105510 [DOI] [Google Scholar]
- 33.Li, D. Y. et al. Experimental study on fracture and fatigue crack propagation processes in concrete based on DIC technology. Eng. Fract. Mech.235(1), 107166 (2020). 10.1016/j.engfracmech.2020.107166 [DOI] [Google Scholar]
- 34.Chen, Y., Wei, J. X., Huang, H. L., Jin, W. & Yu, Q. J. Application of 3D-DIC to characterize the effect of aggregate size and volume on non-uniform shrinkage strain distribution in concrete. Cement. Concrete. Comp.86, 178–189 (2018). 10.1016/j.cemconcomp.2017.11.005 [DOI] [Google Scholar]
- 35.Wu, J., Lu, Y. N., Wang, K. B., Cai, Y. & Xiao, C. Combined effects of freeze–thaw cycles and chemical corrosion on triaxial mechanical properties of sandstone. Geomech. Geophys. Geo.9, 57 (2023). 10.1007/s40948-023-00588-2 [DOI] [Google Scholar]
- 36.Cheng, H., Zhou, X. P., Zhu, J. & Qian, Q. H. The effects of crack openings on crack initiation, propagation and coalescence behavior in rock-like materials under uniaxial compression. Rock Mech. Rock Eng.49(9), 1–14 (2016). 10.1007/s00603-016-0998-9 [DOI] [Google Scholar]
- 37.Yang, S. Q., Yang, D. S., Jing, H. W., Li, Y. H. & Wang, S. Y. An experimental study of the fracture coalescence behaviour of brittle sandstone specimens containing three fissures. Rock Mech. Rock Eng.45(4), 563–582 (2012). 10.1007/s00603-011-0206-x [DOI] [Google Scholar]
- 38.Weng, L., Li, X. B., Taheri, A., Wu, Q. H. & Xie, X. F. Fracture evolution around a cavity in brittle rock under uniaxial compression and coupled static-dynamic loads. Rock Mech. Rock Eng.51, 531–545 (2018). 10.1007/s00603-017-1343-7 [DOI] [Google Scholar]
- 39.Zhang, X. P., Liu, Q. S., Wu, S. C. & Tang, X. H. Crack coalescence between two non-parallel flaws in rock-like material under uniaxial compression. Eng. Geol.199, 74–90 (2015). 10.1016/j.enggeo.2015.10.007 [DOI] [Google Scholar]
- 40.Wong, L. N. Y. & Einstein, H. H. Systematic evaluation of cracking behavior in specimens containing single flaws under uniaxial compression. Int. J. Rock Mech. Min. Sci.46(2), 239–249 (2009). 10.1016/j.ijrmms.2008.03.006 [DOI] [Google Scholar]
- 41.Miao, S. Z. S. Fracture analysis of sandstone with a single filled flaw under uniaxial compression. Eng. Fract. Mech.204, 319–343 (2018). 10.1016/j.engfracmech.2018.10.009 [DOI] [Google Scholar]
- 42.Hofmann, H., Babadagli, T., Yoon, J. S., Zang, A. & Zimmermann, G. A grain based modeling study of mineralogical factors affecting strength, elastic behavior and micro fracture development during compression tests in granites. Eng. Fract. Mech.147, 261–275 (2015). 10.1016/j.engfracmech.2015.09.008 [DOI] [Google Scholar]
- 43.Qi, J. M. et al. Research on crack evolution law and mechanical analysis of three cracked rock masses subjected to compression load. Theor. Appl. Fract. Mech.127, 104035 (2023). 10.1016/j.tafmec.2023.104035 [DOI] [Google Scholar]
- 44.Sun, G. Z. Rock mass structural mechanics (ed. Sun, G. Z.) (Science Press, 1988). (in Chinese).
Associated Data
This section collects any data citations, data availability statements, or supplementary materials included in this article.
Data Availability Statement
The datasets generated and/or analysed during the current study are available in the figshare repository, https://figshare.com/s/6007babb929cf02ee1b4.