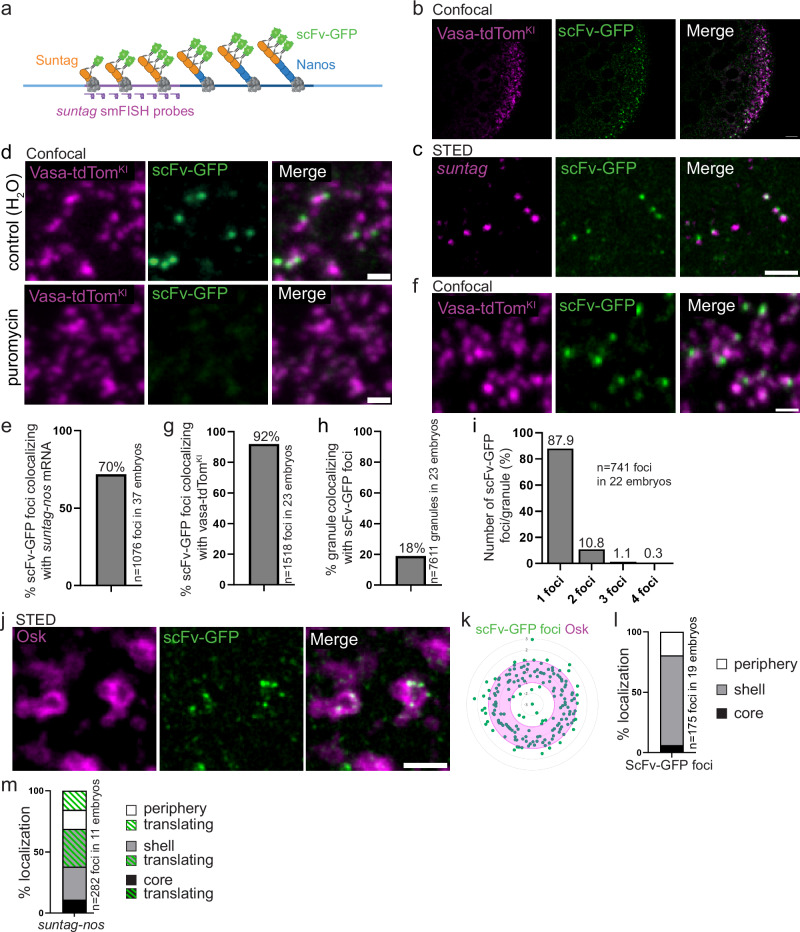
Fig. 2. Visualization of nos mRNA translation at germ granules using Suntag.
a Principle of the Suntag technique to visualize nos mRNA translation. Blue lines: nos mRNA (light blue: UTRs, dark blue: CDS). Purple line: Suntag array. The polysomes are in grey. The Suntag and Nos nascent peptides are in orange and blue, respectively. The scFv-GFP antibody (green) binds the Suntag peptide. suntag smFISH probes are in purple. Created on Biorender.com. b Confocal images of vasa-tdTomKI/nos-suntag-nos; nos-scFv-GFP/+ embryos. Vasa-tdTomato (magenta) and scFv-GFP (green) fluorescence were directly recorded without antibody staining. c STED images of immuno-smFISH of nos-suntag-nos/+; nos-scFv-GFP/+ embryos with anti-GFP nanobody (green) to detect scFv-GFP and suntag smFISH probes (magenta). d Fluorescent confocal images of vasa-tdTomKI/nos-suntag-nos; nos-scFv-GFP/+ permeabilized embryos without (top) and with puromycin treatment (bottom). Vasa-tdTomato (magenta) and scFv-GFP (green) fluorescence were directly recorded. e Percentage of scFv-GFP foci colocalizing with suntag-nos mRNA from images as in (c). f Close-up view of fluorescent confocal images of vasa-tdTomKI/nos-suntag-nos; nos-scFv-GFP/+ embryos showing scFv foci with germ granules. Vasa-tdTomato (magenta) and scFv-GFP (green) fluorescence were directly recorded. g Percentage of scFv-GFP foci colocalizing with germ granules marked with Vasa-tdTom from images as in (f). h Percentage of germ granules marked with Vasa-tdTom colocalizing with scFv-GFP foci, i.e., undergoing translation, from images as in (f). i Quantification of the number of scFv-GFP foci per granule from images as in (f). j STED imaging of nos-suntag-nos/+; nos-scFv-GFP/+ embryos immunostained with anti-Osk antibody (magenta) and anti-GFP nanobody (green) to reveal scFv-GFP. k, l Quantification of svFv-GFP foci localization within the germ granule biphasic structure from STED images as in (j). Radar plot of the relative distance of scFv-GFP foci (green dots) within Osk immunostaining (magenta). The granule shell is in pink (k). Percentage of scFv-GFP foci localized in the core (black), in and at the surface of the shell (grey), and at the immediate granule periphery (white) (l). m Percentage of suntag-nos mRNA foci localized in the core (black), in and at the surface of the shell (grey), and at the immediate granule periphery (white). The green dashed part in each category represents the proportion of suntag-nos foci undergoing translation (i.e., colocalizing with scFv-GFP) from images as in Supplementary Fig. 3e, f. Scale bars: 5 µm in (b), 1 µm in (c–e, j). Source data are provided as a Source Data file. a Created with BioRender.com released under a Creative Commons Attribution-NonCommercial-NoDerivs 4.0 International license.

