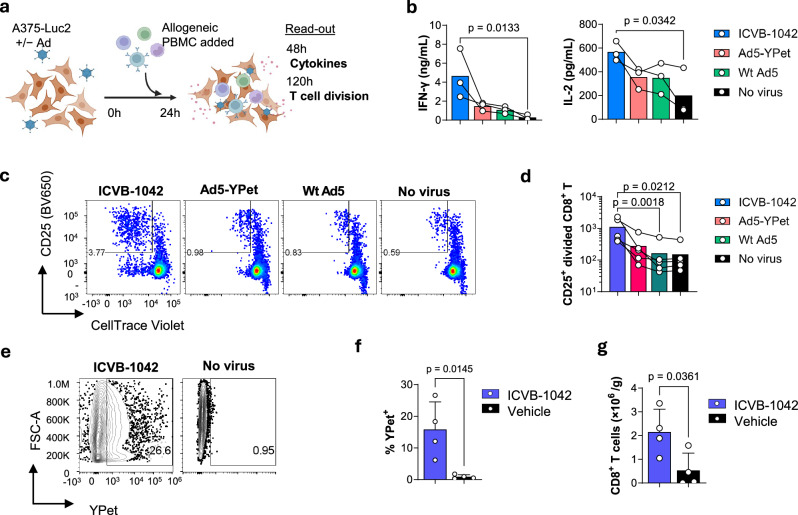
Fig. 7. Immune responses elicited by cancer cells infected with ICVB-1042.
a–d Primary PBMCs from healthy donors were stimulated by coculturing with A375-Luc2 human melanoma cells pre-infected with ICVB-1042, Ad5-YPet, Wt Ad5 at an MOI of 15, or no virus. a Schematic of the coculture experiment. b IFN-γ and IL-2 in the culture supernatant at 48 h were quantified using the Meso Scale Discovery platform. b Representative flow cytometry plots showing proliferation of CD8+ T cells at 120 h. Note that divided CD8+ T cells are identified as CTVlow CD25+. The number in the gate indicates the percentage. c Quantification of divided CD8+ T cells at 120 h. See Supplementary Fig. 16 for the gating strategy. b, d Each symbol represents the average (mean) value of an assay run for a PBMC donor in duplicate, n = 3 (b) and n = 5 (d). Matched data from the same PBMC donors are connected by lines. The bar represents the geometric mean. Statistical analysis was performed using the Friedman test, followed by Dunn’s post-test. Data are representative of 2 independent experiments. e–g Humanized NCG, female, 25-week-old mice (note that these mice were older since they were humanized which is a 12–14-week process) subcutaneously harboring A549 human lung carcinoma were injected IV with ICVB-1042 (n = 4) or vehicle (n = 4) on day 0, 3, and 6. Mice were sacrificed on day 22 and the tumor was analyzed by flow cytometry. e Representative flow cytometry plots showing YPet+ A549 lung carcinoma cells (pre-gated as live, HLA-A/B/C+ single cells). YPet fluorescence indicates infection with ICVB-1042 in vivo. The number in the gate indicates the percentage. f Percentage of YPet+ A549 lung carcinoma cells. g Tumor-infiltrating CD8+ T cells (CD3+ CD8+ live single cells) per gram of tumor tissue.

