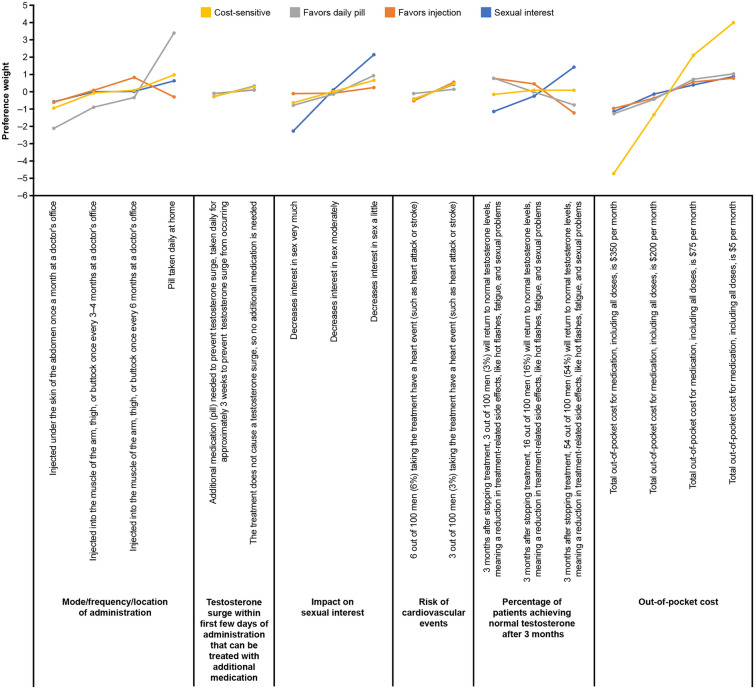
Fig. 2.
Attribute-level preference weights for latent class groups. Attributes are shown in the order in which they were presented to respondents in the discrete choice experiment tasks. The change in relative importance associated with a change in the levels of each attribute is represented by the vertical distance between the preference weights for any two levels of that attribute. Larger differences between preference weights indicate that the change between those two levels is perceived by respondents as relatively more influential to overall utility

