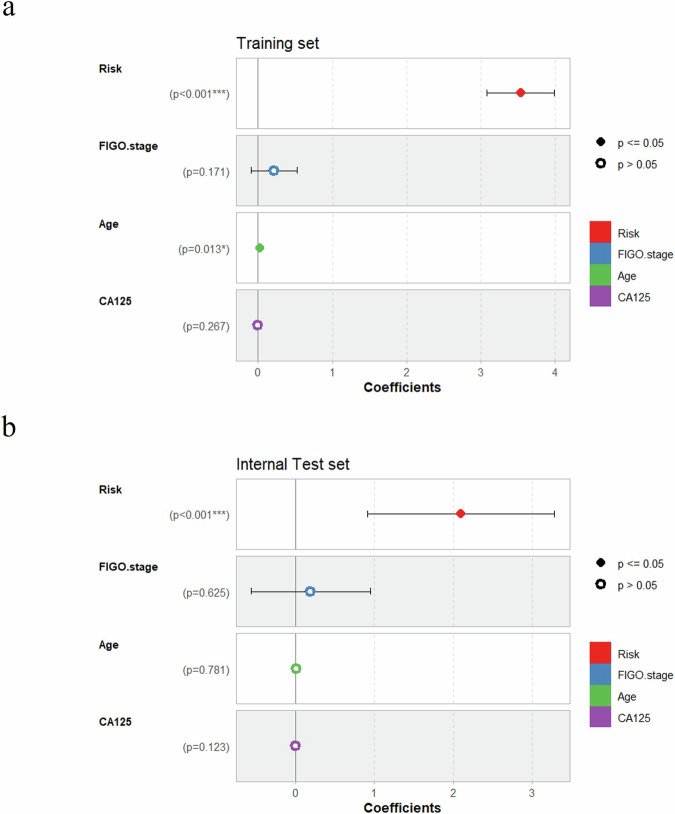
Fig. 3. Forest plots for the multivariable Cox regression analysis.
a Multivariable Cox regression analysis between ResNet18 DL model’s risk and clinical features for PFS in the training set; b Multivariable Cox regression analysis between ResNet18 DL model’s risk and clinical features for PFS in the internal test set. The multivariate Cox regression plot shows the coefficients representing the HR (Hazard Ratio) values for each variable. The horizontal lines indicate the 95% confidence interval for the HR values. Variables that have a significant impact are represented by solid symbols, while those considered not to have a significant impact are represented by hollow circles.

