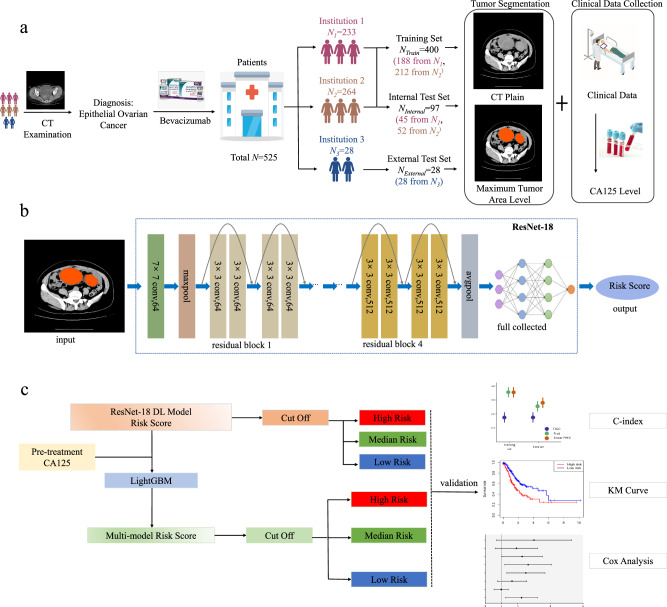
Fig. 8. Workflow of this study.
a Patient cohorts and data preprocessing. Workflow shows the development and validation of our model. b schematic diagram of the ResNet18 DL model. Diagram shows the model structure. c model validation. Flowchart shows the overall grouping and statistical analysis process, including the assessment of risk scores according to Kaplan-Meier (KM) survival analysis, Cox regression analysis and Harrell C-index.

