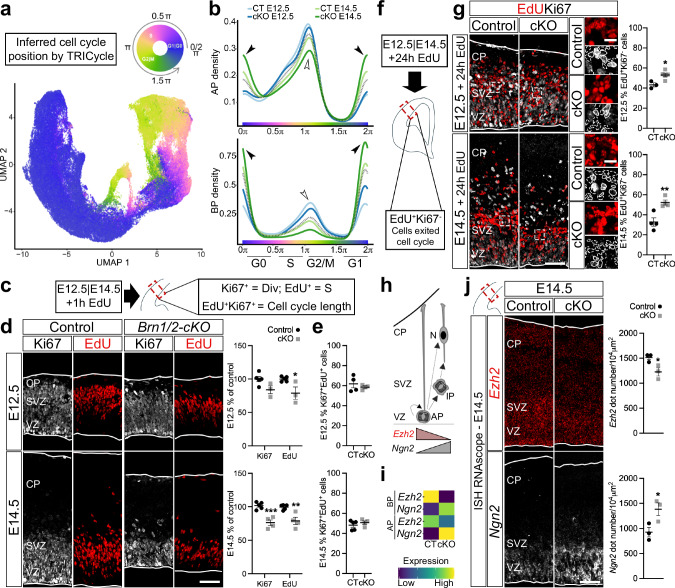
Fig. 2. BRN1/2 regulate cell cycle exit.
a UMAPs from control (CT) and Brn1/2-cKO (cKO) cortices at E12.5 and E14.5 by TRIcycle (Transferable Representation and Inference of cell cycle) analysis40. b Cell cycle phase analysis from control and Brn1/2-cKO apical progenitors (AP) and basal progenitors (BP) at E12.5 and E14.5 represented as cell density (Wilcoxon rank sum test: AP-E12.5 p = 0.085; AP-E14.5 p = 1.84e−15; BP-E12.5 p = 1.95e-06; BP-E14.5 p < 2.2e−16). Empty arrowheads point to reduced S-G2/M state in mutants, arrowheads to increased G1/G0 state. c, f Schematic of the experimental strategy. E12.5 and E14.5 cortices were analyzed by EdU and Ki67 immunolabeling 1 h (c) or 24 h (f) after intraperitoneal injection of EdU. d EdU (red) and Ki67 (grey) immunolabeling in control and Brn1/2-cKO after 1 h EdU injection at E12.5 and E14.5 (E12.5: n = 5 CT, n = 3 cKO mice; E14.5: n = 5 CT, n = 4 cKO mice; two-sided unpaired t-test: E12.5 Ki67 p = 0.1212, E12.5 EdU p = 0.0253, E14.5 Ki67 p = 0.0008, E14.5 EdU p = 0.0053). e EdU labeling index in control and Brn1/2-cKO after 1 h EdU injection at E12.5 and E14.5 (E12.5: n = 4 CT, n = 3 cKO mice; E14.5: n = 5 CT, n = 4 cKO mice; two-sided unpaired t-test: E12.5 p = 0.5296, E14.5 p = 0.4063). g EdU (red) and Ki67 (grey) immunolabeling in control and Brn1/2-cKO after 24 h EdU injection at E12.5 and E14.5 (E12.5: n = 3 CT, n = 5 cKO mice; E14.5: n = 4 mice/group; two-sided unpaired t-test: E12.5 p = 0.0135, E14.5 p = 0.0071). Boxed area at higher magnification on the right. Lines and dashed lines circulating the cells show expression or absence of Ki67, respectively. h Schematic of progenitors dividing and differentiating into neurons. i ScRNAseq expression of Ezh2 and Ngn2 at E14.5 in control and Brn1/2-cKO APs and BPs. j RNAscope for Ezh2 (red) and Ngn2 (grey) in control and Brn1/2-cKO cortices at E14.5 (n = 3 mice/group; two-sided unpaired t-test: Ezh2-p = 0.0357, Ngn2-p = 0.0436). Low and top lines represent the limits of the ventricular zone (VZ) and cortical plate (CP), respectively. SVZ Subventricular Zone, IP Intermediate Progenitors, N Neurons. Values are mean ± SEM; *p < 0.05, **p < 0.01, ***p < 0.001; Scale bars: 50 µm (lower magnification), 10 µm (higher magnification). Source data are provided as a Source Data file.

