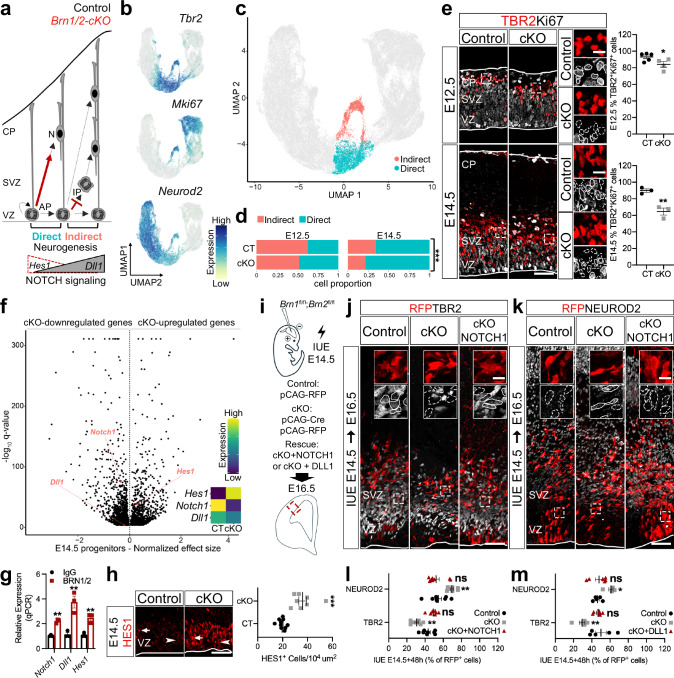
Fig. 3. BRN1/2 regulate the switch from direct to indirect neurogenesis via NOTCH signaling.
a Schematic of progenitor’s neurogenic mode in control (black) and Brn1/2-cKO (red). b UMAP of scRNAseq Tbr2, MKi67 and Neurod2 expression. c UMAP of cells going through indirect and direct neurogenesis in control (CT) and Brn1/2-cKO (cKO) at E12.5 and E14.5. d Proportion of cells going through indirect and direct neurogenesis by age and genotype (Pearson’s Chi-squared test: E12.5-p = 2.212e−11, E14.5-p < 2.2e−16). e TBR2 (red) and Ki67 (grey) immunolabeling in control and Brn1/2-cKO cortical sections at E12.5 and E14.5 (E12.5: n = 5 CT, n = 4 cKO mice; E14.5: n = 3 mice/group; two-sided unpaired t-test: E12.5-p = 0.05, E14.5-p = 0.006). Boxed area at higher magnification on the right. f Volcano plot: differentially expressed genes (DEG) between Brn1/2-cKO progenitors and controls at E14.5 highlighting NOTCH signaling-associated genes (Monocle3 VGAM test; SD = 0.15; q < 0.05; Supplementary Data 3). g ChIP-qPCR analysis of BRN1/2 binding to the indicated promoters/enhancers at E14.5 (n = 3/condition; two-sided unpaired t-test: Notch1-p = 0.0004, Dll1-p = 0.0066, Hes1-p = 0.0042). h HES1 (red) immunolabeling in the ventricular zone (VZ) of control and Brn1/2-cKO cortical sections at E14.5 (n = 10 CT, n = 8 cKO mice; two-sided unpaired t-test: p < 0.0001). i In utero electroporation (IUE) in Brn1fl/fl;Brn2fl/fl mice at E14.5. Cell identities of the control, Brn1/2-cKO and Brn1/2-cKO + NOTCH1 condition immunolabeled for RFP (red), TBR2 (j, grey) and NEUROD2 (k, grey) at E16.5. Boxed area: higher magnification in inserts. RFP+TBR2+ and RFP+NEUROD2+ at E16.5 in the control, Brn1/2-cKO, Brn1/2-cKO + NOTCH1 (l) and Brn1/2-cKO + DLL1 (m) condition (NOTCH1(l): n = 8 CT, n = 8 cKO, n = 7 cKO+NOTCH1; DLL1(m): n = 5 CT, n = 5 cKO, n = 6 cKO+NOTCH1; one-way ANOVA-Dunnett’s multiple comparisons test: NOTCH1-TBR2-p < 0.0001, F2,20 = 20.50; NOTCH1-NEUROD2-p = 0.001, F2,21 = 9.702; DLL1-TBR2-p = 0.0048, F2,13 = 8.294; DLL1-NEUROD2-p = 0.0098, F2,13 = 6.748). Low and top lines represent the limits of the VZ and cortical plate (CP), respectively. Lines and dashed lines outline cells expressing or lacking expression of the indicated marker, respectively. SVZ Subventricular Zone, IP Intermediate Progenitors, N Neurons. Values are mean ± SEM; ns, not significant; *p < 0.05, **p < 0.01, ***p < 0.001. Scale bars: 50 µm (lower magnification), 10 µm (higher magnification). Source data are provided as a Source Data file.

