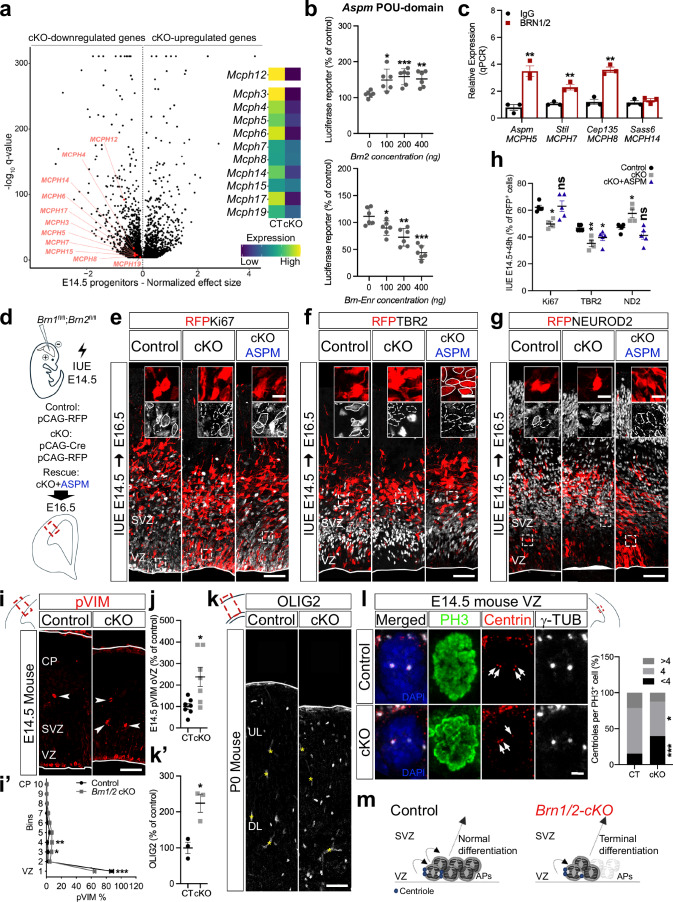
Fig. 4. BRN1/2 are required for the expression of microcephaly-associated genes and maintenance of the neuronal progenitor pool.
a Volcano plot: DEG between Brn1/2-cKO and control progenitors at E14.5 highlighting primary microcephaly genes (Monocle3 VGAM test; SD = 0.15; q < 0.05; Supplementary Data 3). b Luciferase reporter-activity of Aspm when co-expressed with Brn2 or Brn-Enr (n = 6/condition; two-sided unpaired t-test: Brn2: 100-p = 0.0128, 200-p = 0.0006, 400-p = 0.0015; Enr: 100-p = 0.0268, 200-p = 0.0018, 400-p = 0.0001). c ChIP-qPCR analysis of BRN1/2 binding to the indicated promoters/enhancers at E14.5 (n = 3/condition; two-sided unpaired t-test: Aspm-p = 0.0038, Stil-p = 0.0053, Cep135-p = 0.0011, Sass6-p = 0.4289). d In utero electroporation (IUE) in Brn1fl/fl;Brn2fl/fl mice at E14.5. Cell identities of the control, Brn1/2-cKO and Brn1/2-cKO + ASPM condition immunolabeled for RFP (red), Ki67 (e, grey), TBR2 (f, grey) and NEUROD2 (g, grey) at E16.5. Boxed area: higher magnification in inserts. Lines and dashed lines outlining cells expressing or lacking expression of the indicated marker, respectively (n = 5 CT, n = 4 cKO, n = 5 cKO+ASPM mice; one-way ANOVA-Dunnett’s multiple comparisons test: Ki67-p = 0.0132, F2,11 = 6.582; TBR2-p = 0.0055, F2,11 = 8.681; NEUROD2-p = 0.0033, F2,11 = 10.02). i pVIM immunolabeling in control and Brn1/2-cKO mice at E14.5. Arrowheads: pVIM+ cells outside of the VZ (oVZ). i’ Distribution of pVIM+ cells in control (CT) and Brn1/2-cKO (cKO) cortices (n = 7 mice/group; two-way ANOVA-Šídák’s multiple comparisons test: 1-p < 0.0001, 3-p = 0.0403, 4-p = 0.0025, F9,120 = 25.73). j pVIM+ cells in control and Brn1/2-cKO oVZ (n = 7 mice/group; two-sided unpaired t-test: p = 0.0122). k, k’ OLIG2 immunolabeling in cortical sections of control and Brn1/2-cKO mice at P0 (n = 3 mice/group; two-sided unpaired t-test: p = 0.0140). l Centriole number/PH3+ cell in the ventricular zone (VZ) of control and Brn1/2-cKO at E14.5 (n = 3 mice/group; two-sided unpaired t-test: <4-p = 0.0002, 4-p = 0.0383, >4-p = 0.1018). Arrows indicate centrioles. m Schematic of centrosome function and progenitor cell differentiation in control (black) and Brn1/2-cKO (red). Low and top lines represent the limits of the VZ and cortical plate (CP), respectively. Yellow asterisks indicate auto-fluorescent blood vessels. SVZ Subventricular Zone, UL Upper Layers, DL Deep Layers, APs Apical Progenitors. Values are mean ± SEM; *p < 0.05, **p < 0.01, ***p < 0.001. Scale bars: 50 µm (lower magnification; e-g, i, and k), 10 µm (higher magnification; e-g), 2 µm (l). Source data are provided as a Source Data file.

