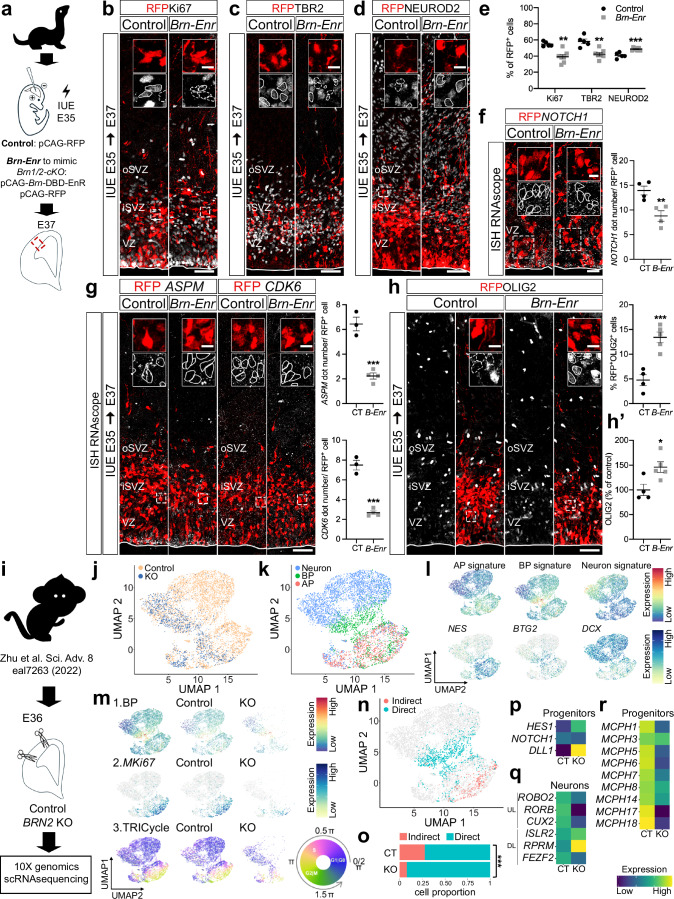
Fig. 5. BRN1/2 function is conserved across mammalian species.
a In utero electroporation (IUE) in wild-type ferrets at E35. Cell identities of the control (CT) and Brn-Enr (B-Enr) condition immunolabeled for RFP (red), Ki67 (b, grey), TBR2 (c, grey) and NEUROD2 (d, grey) at E37 (n = 4 CT, n = 7 Brn-Enr ferrets; two-sided unpaired t-test: Ki67-p = 0.0014, TBR2-p = 0.0012, NEUROD2-p = 0.0004). f NOTCH1 (grey) expression in RFP+ cells of the electroporated ventricular zone (VZ) (n = 4 ferrets/group; two-sided unpaired t-test: p = 0.0099). g ASPM or CDK6 (grey) expression in RFP+ cells of the electroporated cortex (n = 3 CT, n = 4 Brn-Enr ferrets; two-tailed unpaired t-test: ASPM-p = 0.0006, CDK6-p = 0.0001). h RFP+ cells expressing OLIG2 (gray) in the electroporated cortex (n = 4 CT, n = 5 Brn-Enr ferrets; two-sided unpaired t-test: p = 0.0009). h’ Total OLIG2+ cells in the electroporated cortex (n = 4 CT, n = 5 Brn-Enr ferrets; two-sided unpaired t-test: p = 0.0226). i ScRNAseq DATA from E36 cortex of control (CT) and BRN2KO (KO) cynomolgus monkey24 re-analyzed using the same pipeline we used for the analysis in mice. UMAP of scRNAseq from control and BRN2KO by genotype (j) and cell type (k). l UMAP of gene signatures for apical progenitors (AP; e.g., NES), basal progenitors (BP; e.g., BTG2) and neurons (e.g., DCX) in control and BRN2KO. m UMAP of BP signature (1), MKi67 expression (2) and TRIcycle score (3) in control and BRN2KO. n UMAP of cells going through indirect and direct neurogenesis in control and BRN2KO. o Proportion of cells going through indirect and direct neurogenesis by genotype (Pearson’s Chi-squared test: p = 4.454e-12). p Expression of NOTCH signaling-associated genes in control and BRN2KO progenitors. q Expression of the indicated cortical upper layer (UL) and deep layer (DL) neuronal marker genes in control and BRN2KO neurons. r Expression of primary microcephaly DEG in BRN2KO progenitors compared to controls. Boxed areas: higher magnification in inserts. Lines and dashed lines outline cells expressing or not expressing the indicated marker, respectively. iSVZ Inner Subventricular Zone, oSVZ Outer Subventricular Zone. Values are mean ± SEM; *p < 0.05, **p < 0.01, ***p < 0.001. Scale bars: 50 µm (lower magnification), 10 µm (higher magnification). Source data are provided as a Source Data file.

