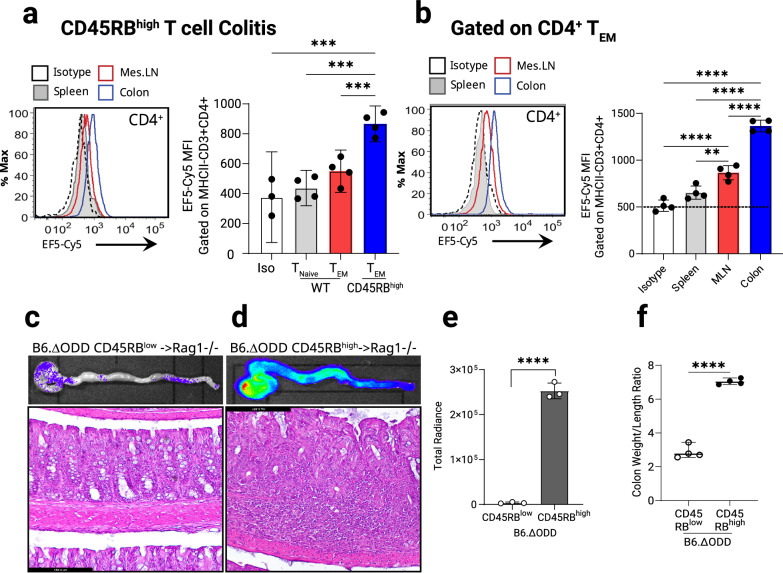
Fig. 1. Stabilization of Hypoxia Inducible Factor in colitogenic CD4+ T cells during experimental colitis.
Chronic T cell-mediated colitis was induced in B6.B6.RAG1−/− mice by intraperitoneal injection (0.5 × 10⁶) of naïve CD4+ CD45RBhigh or CD45RBlow T cells. Identification of 2-nitroimidazole EF5 hypoxic adducts in B6.B6.RAG1−/− mice injected with C57BL/6J/6JT cells. 6 weeks post-treatment spleens, lymph nodes and collagenase-digested colon tissues were assessed. a Flow cytometric sub-analysis of cellular profile within Cy5-labeled EF5 (nitroimidazole; injected IP-3h) naïve and effector memory CD4+ T cells from the spleen, mesenteric lymph nodes and the colons, (n = 3–4, one-way ANOVA). b Effector memory CD4+ T cells from the spleen, mesenteric lymph node (MLN) and collagenase digested colons (gated on CD44 + CD62L−) and labeled with EF5-Cy5. Identification of stabilized HIF in dissected colons by IVIS imaging from mice adoptively transferred with 0.5 × 10⁶ B6.ΔODD.luc CD4+ T cells. Prior to euthanizing, mice were injected with Luciferase substrate for 10 min. Freshly dissected colons were flushed and imaged using IVIS. Representative IVIS photograph and corresponding colon micrograph sections were stained with H&E, n = 4. c Healthy colons from CD45RBlow transferred mice, with low luciferase activity in the upper panel. Colon histological sections (lower panel, Scale bar: 184.4 mm). d High luciferase activity in whole colon (upper panel) and histology micrograph with lymphocyte infiltrates in CD45RBhigh transferred mice at 6-week post transfer (lower panel, Scale bar: 184.4 mm). e Image radiance was quantified using IVIS and expressed as photons/sec/cm2/sr. (n = 3, two-tailed T test). f Colon inflammation score (weight/length) in adoptively transferred animals from (c) and (d) (n = 4, two-tailed T test). Male and female mice used in (a) and (b), male recipients and male and female donors used in (c)–(f). Radiance of IVIS image was quantified and expressed as photons/sec/cm2/sr. Data expressed as Mean ±S.E.M., *p < 0.05, **p < 0.01, ***p < 0.001, ****p < 0.0001 vs. indicated.

