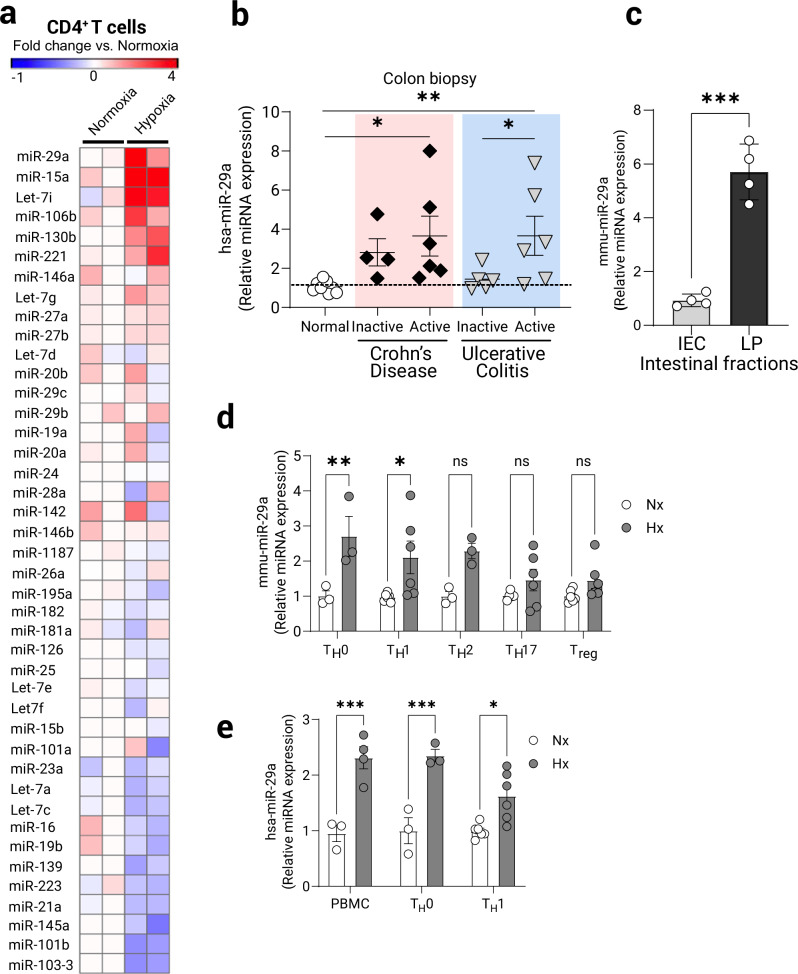
Fig. 2. Specific induction of miR-29a in CD4+ T cells following experimental hypoxia.
Primary naïve CD4+ T cells were isolated from spleens and MLN of C57BL/6J/6J mice and cultured ex vivo for 8 h with TCR stimulation (anti-CD3/28) in either normoxia (21% O2) or hypoxia (1% O2). RNA was prepared and assayed using custom limited-target T cell Q-PCR microRNA array (Qiagen). a Heat-map representing respective increased and decreased T cell-expressed miRNAs following treatment. Fold change over the average of two normoxia samples is depicted as color change (n = 2/group). b Assessment of miR-29a expression by Q-PCR in colon biopsies from patients with inflammatory bowel disease. Patient characteristics included in Supplementary Table 1, (n = 4–10 patients/group, one-way ANOVA). c Normal mouse colon tissue was fractionated into intestinal epithelial cells (IEC) and lamina propria cells (LP) and baseline levels of miR-29a were assessed using Q-PCR, (n = 4, two-tailed T test). d Primary naïve CD4+ T cells were isolated from spleens of C57BL/6J/6J mice and cultured ex vivo under helper T cell polarizing conditions with rmIL-2 and anti-CD3/anti-CD28 stimulation for 3 days, then washed and rested for 48 h, followed by 8 h stimulation (anti-CD3/28) in either normoxia (21% O2) or hypoxia (1% O2). miR-29a expression was assessed by Q-PCR (n = 3–6, two-way ANOVA). e Primary human CD4+ T cells were isolated from peripheral blood of healthy volunteers and cultured similarly as mouse CD4+ T cells but with only TH0 and TH1 specific stimuli. miR-29a expression was assessed by Q-PCR following TCR-stimulation under normoxia or hypoxia for 8 h, (n = 3–5, two-way ANOVA). Male and female mice used as cell donors in (a, c–e). Data expressed as mean ±S.E.M., *p < 0.05, **p < 0.01, ***p < 0.001 vs. counterparts.

