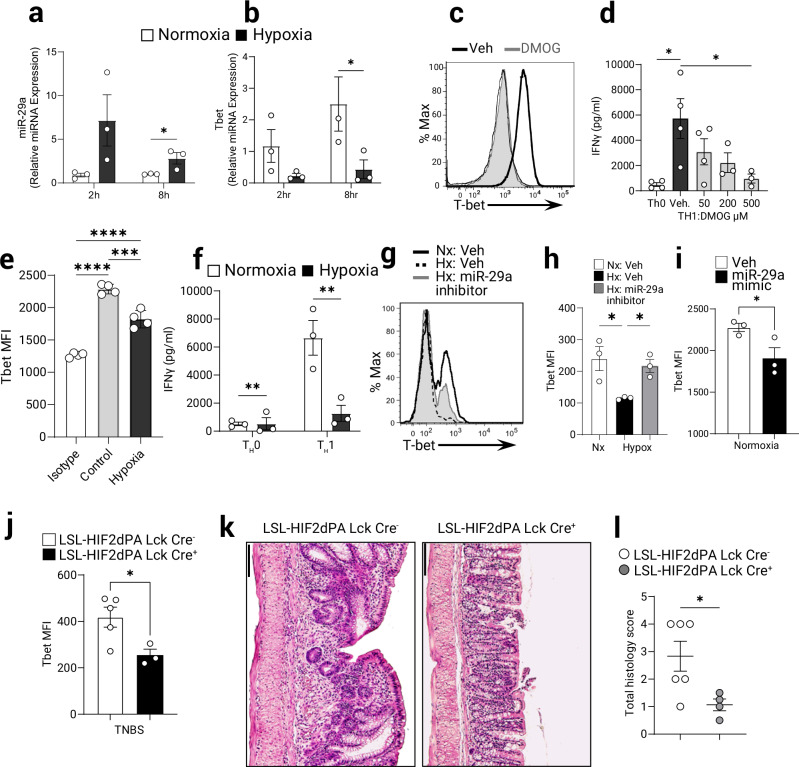
Fig. 4. T-bet expression in CD4+ TH1 T cells is specifically repressed during hypoxia via miR-29a.
MicroRNA-29a targets T-bet expression in vitro and in vivo. CD4+ T cells were isolated from spleens and MLN of WT (B6) mice and cultured ex vivo with anti CD3/CD23 for indicated time under normoxia (21% O2) or hypoxia (1% O2). a mRNA expression of miR-29a in CD4+ T cells was measured by Q-PCR (n = 3, one-tailed T test), and b mRNA expression of T-bet was measured by Q-PCR following 2 h and 8 h in either normoxia (21% O2) or hypoxia (1% O2), (n = 3, pooled 2 experiments, two-way ANOVA). CD4+ T cells were isolated from spleens and MLN of WT (B6) mice and cultured ex vivo under TH1 polarizing conditions. Differentiated TH1 T cells were stimulated with anti-CD3/anti-CD28 under normoxia (21% O2) or hypoxia (1% O2) for 1 day. c T-bet protein was measured by flow cytometry in TH1 T cells untreated or treated with DMOG (conc. 500 μM). Representative plot shown. d IFNγ secretion from TH1 T cells treated with DMOG was assessed by ELISA (n = 3–4, one-way ANOVA). e T-bet protein expression was measured by flow cytometry in cells stimulated for 24 h under normoxia or hypoxia (n = 4, one-way ANOVA). f IFNγ secretion in TH0 or TH1-skewed cells was assessed by ELISA on day 3 (n = 3, 2-way ANOVA). T-bet protein expression measured by flow cytometry in TH1 differentiated CD4+ T cells transfected with specific mi-29a inhibitor (g, h) or miR-29a mimetic (i) and activated with anti CD3/CD28 in normoxia or hypoxia for 48 h. g Representative flow cytometry profile of T bet expression. h Quantitation of Tbet fluorescence from (g) (n = 3, one-way ANOVA). i Quantitation of Tbet in cells transfected with miR-29a mimic and analyzed by flow cytometry (n = 3, one-tailed T test). TH1 colitis was induced in LSL-HIF2dPA Lck Cre + mice and controls by epicutaneous skin sensitization followed by rectal gavage with TNBS as per Materials and Methods. j T-bet protein expression in gated CD4+ T cells purified from lamina propria was measured by flow cytometry (n = 3–5, two-tailed T test). k Representative micrographs of TNBS-treated colons from LSL-HIF2dPA Lck Cre+ or Cre- littermate controls stained with H&E, bar = 100 mm. l Histological scores from LSL-HIF2dPA Lck Cre+ or Cre- littermate controls following TNBS trial (n = 4–6, two-tailed T test). Male and female mice used in (a–l). Data expressed as Mean ± S.E.M, *p < 0.05, **p < 0.01 vs. indicated.

