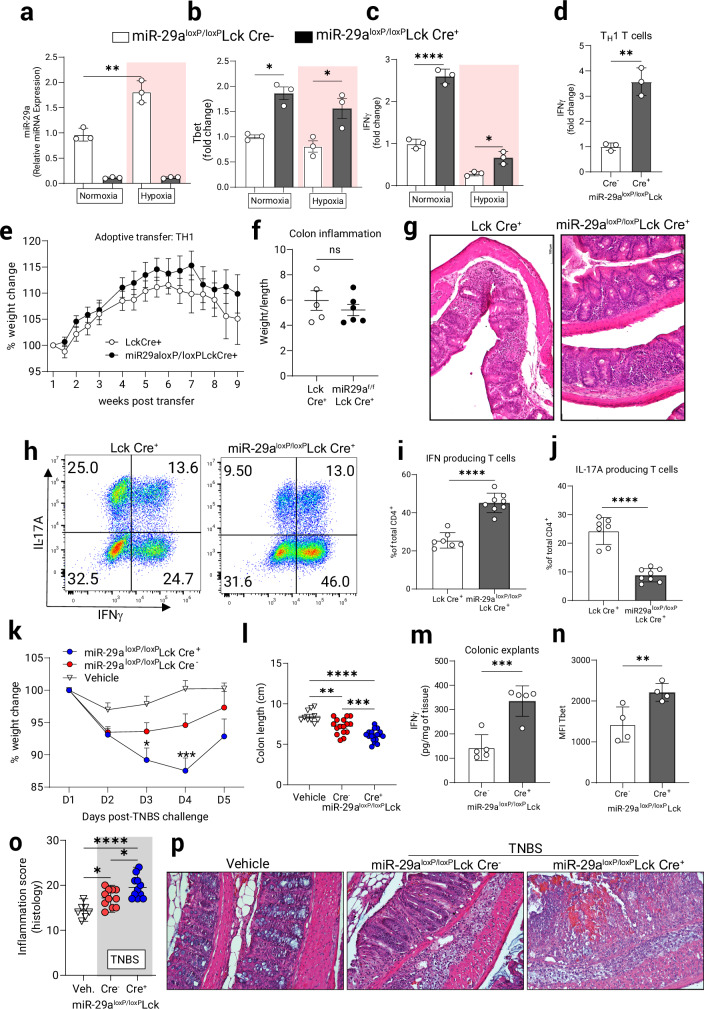
Fig. 6. T cell-intrinsic miR-29a regulates T cell function in vitro and in vivo.
Naïve CD4+ T cell were purified from miR-29aloxP/loxP Lck Cre + or Cre- mice and stimulated with anti-CD3/anti-CD28 for 5 h in normoxia (21% O2) or hypoxia (1% O2). Q-PCR assays were employed to measure: (a) microRNA expression of miR-29a, (n = 3, two-way ANOVA). b mRNA expression of T-bet, c mRNA expression of IFNγ. (b, c: n = 3, repeated 2 times, two-way ANOVA). d mRNA level of IFNγ in TH1-skewed T cells grown in vitro for 3 days and then re-stimulated with anti-CD3/anti-CD28 for 8 h, (n = 3, two-tailed T test). 7-week-old B6.RAG1−/− recipient mice were adoptively transferred with 106 in-vitro differentiated CD4+ TH1 T cells from Lck Cre+ and miR-29aloxP/loxP Lck Cre+ mice and weight changes were recorded twice per week. e Weight change chart with transient weight gain followed by continuous weight loss in the course of colitis development, (n = 7–8). f Colon inflammatory score (colon weight/length), (n = 6, n.s). g Representative micrographs of H&E staining in the colon show infiltration of lymphocytes into the intestinal epithelium in Lck Cre+ and miR-29aloxP/loxP Lck Cre+ mice. Original magnification ×20, scale bar: 100 mm. Mesenteric lymph node (MLN) cells were isolated and re-stimulated for 5 h in vitro with PMA/Ionomycin in the presence of Brefeldin A, stained for intracellular cytokines and gated on live CD4+ lymphocytes. h Representative plots for each mouse group are shown. i Proportion of IFNγ producing CD4+ T cells in the MLN (n = 7–8, two-tailed T test). j Proportion of IL-17 producing CD4+ T cells (n = 7–8, two-tailed T test. TH1 colitis was induced in miR-29aloxP/loxP Lck Cre+ mice and controls by the epicutaneous skin sensitization and subsequent rectal gavage with TNBS as per Materials and Methods. k Weight loss curve, (n = 8–12, two-way ANOVA). l Colon length in TNBS-challenged mice (n = 10–18, one-way ANOVA). m Colonic explants were cultured for 24 h and IFNγ release was measured using ELISA, (n = 5, two-tailed T test). n At the time of necropsy, lamina propria lymphocytes (LPL) were purified and CD4+ T cells were assayed by flow cytometry for expression of Tbet protein (n = 4, one-tailed T test). o Histological index of colitis. (n = 8–11, One-way ANOVA). p Representative micrographs from TNBS-treated miR-29aloxP/loxP Lck Cre+, miR-29aloxP/loxP Lck Cre- or vehicle -treated mice 5 days post-challenge, scale bar is 100 mm. Male and female mice used in (a–d, k–p). Male recipients and mixed male/female donors used in (e–j). *p < 0.05, **p < 0.01, ****p < 0.0001 vs. indicated, Q-PCR microRNA expression normalized to RNU6B and mRNA expression to 18s rRNA.

